DDoS monitoring: how to know you’re under attack
A while back, we covered how you can check your Windows IIS and Loggly logs to view the source of a DDoS attack, but how do you know when your network is under attack? It is not efficient to have humans monitoring logs every day and every hour, so you must rely on automated resources. Automated DDoS monitoring gives your security team more bandwidth to focus on other important tasks and still get notifications should anomalies happen as a result of a DDoS event.
What Is a DDoS Attack?
In short, a DDoS attack is a flood of traffic to your web host or server. With enough traffic, an attacker can eat away at your bandwidth and server resources until one (or both) are so inundated that they can no longer function. The server crashes, or there just isn’t enough bandwidth to allow true customers to access your web service. As you can probably guess, this means a crash in your service and loss in revenue for as long as the attack continues.
DDoS attacks can be devastating to an online business, which is why understanding how they work and how to mitigate them quickly is important. During the attack, there isn’t one source, so you can’t just filter one IP to stop it. DDoS attackers infect user systems (that can mean computers but also embedded systems or IoT devices) with software that allows them to control them around the globe. The attacker uses a centralized system that then tells these malware-infected machines to send traffic to the site. The number of machines at the attacker’s disposal depends on the number of machines infected, but it can be in the tens of thousands. To make things worse, DDoS malware is typically very sophisticated and employs techniques to overload your server as efficiently as possible, for example by sending incomplete connection requests that cause wait states on your system, during which the attacking system can send new requests.
You can usually identify how much of an attack you can withstand. If your normal traffic is 100 connections at a time throughout the day and your server runs normally, then 100 machines vying for a connection will probably not affect you. However, with a DDoS attack it will be thousands of connections from numerous different IPs at one time. If your server can’t handle 10,000 connections at a time, then you could be vulnerable to a DDoS attack.
Without warning, you have hundreds or thousands of machines (servers, desktops, and even mobile devices) sending traffic to your site at once. Within minutes, your site’s performance and resources are severely drained and normal users cannot access your site.

How Do You Know When a DDoS Attack Is Occurring?
The hardest part about a DDoS attack is that there are no warnings. Some large hacking groups will send threats, but for the most part an attacker sends the command to attack your site with no warnings at all.
Since you don’t normally browse your site, it isn’t until customers complain that you finally realize something is wrong. Initially, you probably don’t think it’s a DDoS attack but instead think your server or hosting is down. You check your server and perform basic tests, but you will only see a high amount of network traffic with resources maxed out. You might check to see if any programs are running in the background, but you won’t find any noticeable problems.
Between the time it takes for you to realize it’s a DDoS attack and the time it takes to mitigate the damage, several hours can go by. This means several hours of missed service and income, which essentially takes a major cut in your revenue.
DDoS Attack Clues
The most effective way to mitigate a DDoS attack is to know when it’s happening immediately when the attack begins. There are several clues that indicate an ongoing DDoS attack is happening:
- An IP address makes x requests over y seconds
- Your server responds with a 503 due to service outages
- The TTL (time to live) on a ping request times out
- If you use the same connection for internal software, employees notice slowness issues
- Log analysis solutions show a huge spike in traffic
Most of these signs can be used to automate a notification system that sends an email or text to your administrators.
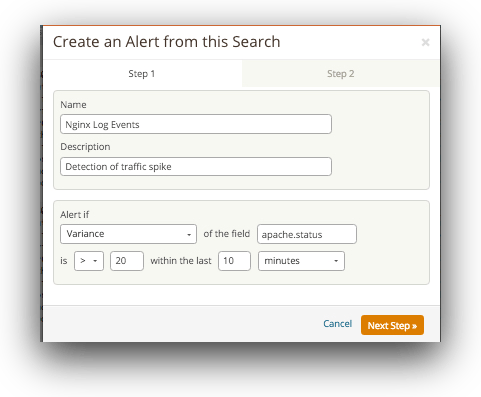
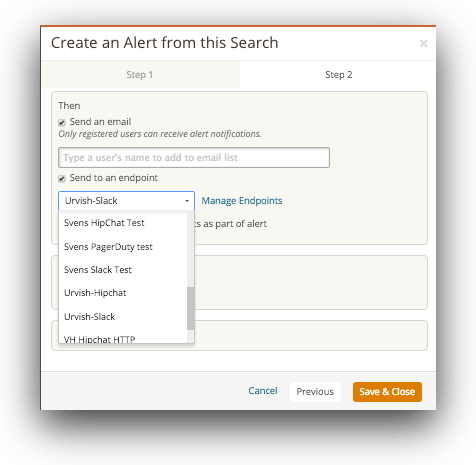
Loggly can send such alerts based on log events and defined thresholds, and even send these alerts to tools like Slack, Hipchat, or PagerDuty.
Too Many Requests for One IP
You can temporarily set up the router to send traffic to NULL routes from specific IPs. This essentially sends the attacking IP addresses to a void or dead end, so that it cannot affect your servers. This is somewhat difficult, because you can easily block a legitimate IP address as you attempt to stop the attack. Another issue is that the source IP is usually spoofed, so the connection is never completed between your server and the source machine.
Setting alerts from the firewall or intrusion prevention or detection system can be tricky, because again some legitimate bots will be picked up as an attack. The configuration and settings also depend on the system that you have.
Overall, you want to set an alert to go out if a range of IP addresses sends too many connection requests over a small window of time. You will likely need to whitelist certain IP addresses, because ones such as Googlebot will crawl your site at a very fast and frequent rate. It will take some time and tweaking before you get this alert to work properly since you will legitimately want some bots and scripts to run that could send a false positive to your alert system.
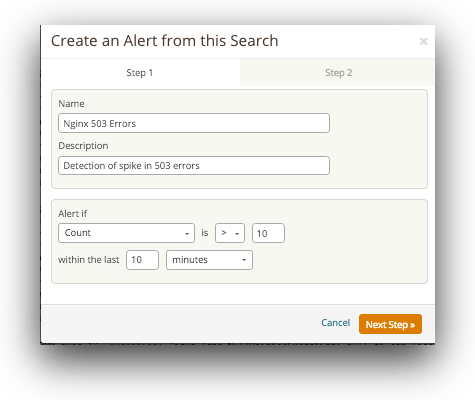
Server Responds with a 503
In Windows, you can schedule alerts when a specific event happens in Event Viewer. You can attach any task to an event including errors, warnings, or any other event that might help you mitigate an issue before it becomes a critical situation.
To attach a task to a 503 event, you first need to find the event in Event Viewer. Open Event Viewer and right-click on the event.
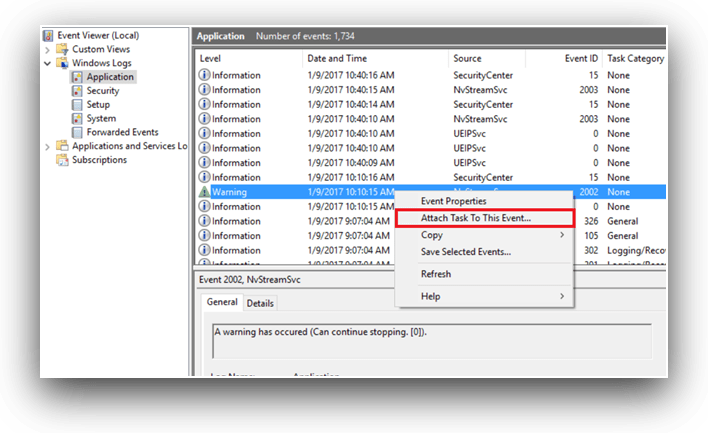
This opens a configuration screen where you can configure the event to send an email to an administrator or to a team of people.
If you have multiple servers, it’s efficient to set up a similar alert using Loggly:
TTL Times Out
You can manually ping your servers to test the bandwidth and connection, but this doesn’t help when you want to automate an alert before it’s critical. If you’re pinging the server, then you already know there is something wrong.
To help automate ping alerts, several services on the web offer a way to ping your site from around the world. The service pings your site from various regions around the globe at a frequency that you configure. If you have cloud hosting, you could have an issue in one region but not another, so these pinging services help you identify issues in certain locations.
Just a few pinging services are listed here. With these services, your site is monitored 24/7 for uptime, so your IT team can respond should your server experience issues. Because a DDoS attack eats away at your bandwidth, the ping time will be too long or time out. The service sends an alert to your team, so they can start mitigation techniques and troubleshoot the issue.
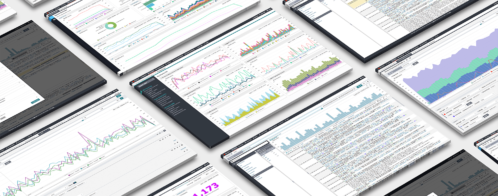
Log Management Systems and DDoS Attack Monitoring
Solutions such as Loggly display your traffic statistics across your entire stack and help you identify if there are any anomalies 24/7. Using Loggly, you can identify an ongoing attack and send alerts to your administrators. The advantage to using these logs is that you can not only identify traffic spikes, but you can identify the servers affected, the errors returned to your users, and the precise date and time the traffic spikes occurred. Analyzing tools do much more than just tell you there is a problem. They also tell you the servers affected to save you troubleshooting time.
With log management systems, you have several more advantages than the other solutions. You can set alerts for any type of event, which makes this type of system much more flexible than setting an alert for traffic only.
You can also make your alerts much more granular. For instance, with an alert based on an IP at your firewall, you will get several false positives until you tweak your alert configurations to only include suspicious IPs. With Loggly, you can set your alerts based on a combination of events and traffic spikes, so that you get only those anomalies that should interrupt IT personnel and have them respond quickly.
A note about alerts: too many of them can have an opposite effect on IT teams. For instance, suppose you have your system set up to send alerts on several anomalies that are usually benign. Your team gets hundreds of alerts a day based on these configurations. When inundated with harmless events, IT folks tend to ignore all of them including important ones. It’s not intentional, but when receiving hundreds of alerts a day, the important ones can get buried and the result is that IT has an oversight during a critical outage.
Arm Yourself Against DDoS
DDoS events are difficult but essentially a major security concern for administrators. But with some automation and alerts, you can trigger the right proactive notifications that limit the time it takes to identify and stop a DDoS attack.
Now that you’ve learned ddos monitoring and how to tell if you are under attack, signup for a FREE no-credit card required Loggly Trial and view app performance, system behavior, and unusual activity across the stack. Monitor your key resources and metrics and eliminate issues before they affect your server and users.
>> Signup Now for a Free Loggly Trial
The Loggly and SolarWinds trademarks, service marks, and logos are the exclusive property of SolarWinds Worldwide, LLC or its affiliates. All other trademarks are the property of their respective owners.

Jennifer Marsh