Front-end logging made easy: use this JavaScript logger
Developing applications that run in browsers can be terrifying given that you have very limited control over the environment in which your code will be running. It can also be very exciting because you get to work in a discipline that innovates very quickly and can reach a large number of users. With web applications getting more sophisticated, it’s crucial to build a good culture around logging behavior across the stack, including the front-end. Proper logging on the front-end can provide you with:
- Insight into how customers are using your product
- Objective metrics that you can use to make important decisions (for example, getting buy-in from management to spend time on what you believe is important is a lot easier if you can provide metrics that prove your case)
- The ability to find problems (or opportunities) you didn’t even know you had
Most importantly, if you want to improve something (e.g. error rates, site performance), you have to be able to measure it. (For an interesting read about monitoring performance, read my colleague Mauricio’s blog post.)
The Loggly JavaScript Logger Makes It Easy to Get Started
When I joined Loggly, I was pleasantly surprised at the logging that we had in place. Since our site is a Single Page Application (SPA), a single session of a user perusing log files can result in dozens, if not hundreds, of HTTP requests made to our backend. We track all errors as well as how long each part of a request takes, from the browser to the database and the multiple services in between that handle a request. Knowing how much each step adds to the total round trip time has been crucial in helping us decide which components to first invest our time in optimization.
It’s surprisingly easy to get started when logging on the front-end:
- Sign up for a Loggly account if you don’t already have one.
- Include Loggly’s JavaScript logging tracker as one of the assets you load on your page. (The tracker is asynchronous and won’t block page loads.) Alternatively, you can use our AngularJS tracker.
That’s it! You now have access to a global object called “_LTracker” with a method called “push”. You can pass it an object, and the tracker will handle serializing it in JSON and sending the event to Loggly to be parsed and indexed, like this:
My colleague Jason Skowronski wrote a good article that covers tips on logging in JSON. One tip I would add is to take advantage of the hierarchical nature of JSON. For example, if you want to namespace all the information you log about API calls, it’s easy to log them all in a flat list, like this:
But they will be more meaningful if you can namespace fields using a hierarchy, like this:
Once it’s indexed, you can get summaries on values by field in Loggly Dynamic Field Explorer:
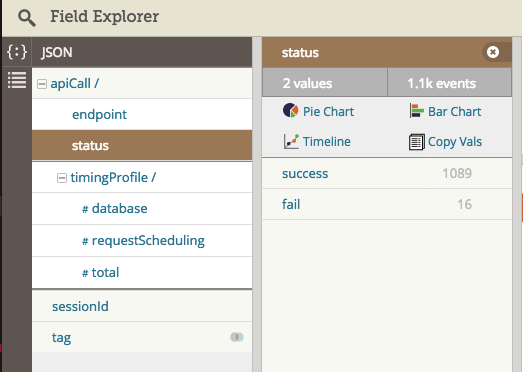
In this case, you have quick access to the count of the values for the metrics you log. You could then easily filter down for all the fails and investigate any issues. You can also set alerts when you error rate is higher than you expect. For example, you would want to know any time there are more than 10 errors per hour, if that’s what your error threshold rate is. You can also graph counts of errors and other metrics over time directly from Field Explorer.
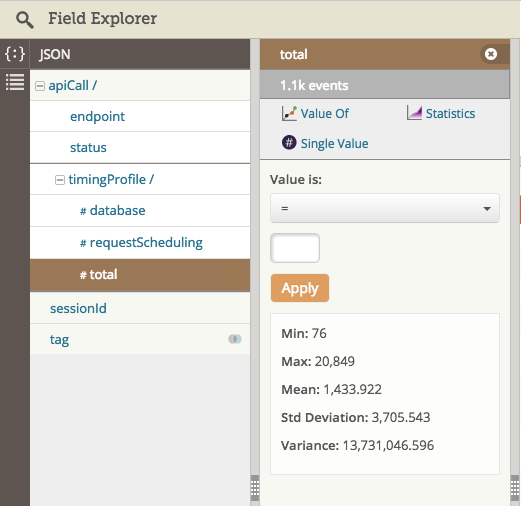
For numeric fields, Field Explorer provides quick access to descriptive statistics for the time range you searched on. You can filter for events that match a numeric operator (e.g. all events where total was greater than 1000, or between 0 and 500 (assuming you’re logging milliseconds), You can also set up alerts so you’re emailed whenever your response rate may be above a certain acceptable threshold (e.g. there are more than 10 events in minute that take over a 1000ms to respond).
If you structure your log data clearly, Field Explorer becomes a very powerful tool to help you make sense of your log data. Here’s an example of how you can log information about how long your Ajax requests take/how many errors you may get:
This function may be long, but it could also be abstracted out to handle a lot of your data called.
I hope that this post has shown you just how easy it is to log in the browser and then explore that information using Field Explorer. So you really have no excuses for not logging on the front-end!
If you don’t already have a Loggly account, I encourage you to start a free trial now.
The Loggly and SolarWinds trademarks, service marks, and logos are the exclusive property of SolarWinds Worldwide, LLC or its affiliates. All other trademarks are the property of their respective owners.

Vin Halbwachs