Monitoring Performance Using SolarWinds Loggly and AppOptics

Behind every application, service, and website is a healthy host. In order for DevOps teams to deliver fast, responsive, and stable applications, they need tools to monitor the performance and stability of these hosts. Monitoring helps teams not only identify problems such as high resource usage and errors, but also detect trends and potential changes in performance.
Logs and metrics play a significant role in monitoring production systems. We recently announced integration around host monitoring with SolarWinds® AppOptics™, which provides application performance monitoring (APM) and metrics collection for your entire infrastructure. Using Loggly® and AppOptics together provides you with converged application and infrastructure monitoring capabilities and the ability to drill into your logs to quickly identify trends and potential issues.
In this article, we’ll show how integrating AppOptics with Loggly helps you identify, troubleshoot, and resolve performance problems.
The Importance of Tracking Both Logs and Metrics
Logs and metrics record different kinds of data essential to observability. Logs provide contextual data about specific events and occurrences, while metrics provide periodic snapshots of an application or host’s state. Treating these as independent resources makes sense from an operational perspective, but both are necessary to gain a complete view of your infrastructure. For example, a host failure could cause a sudden change in metrics that could only be explained by viewing the host’s logs.
Some solutions have tried to fix this, such as embedding metrics directly into logs. For example, the Apache and Nginx web servers can include HTTP response times with each response that gets logged. While Loggly does offer some metrics dashboards for Apache and Nginx, a solution like AppOptics APM tools give you more insight into the performance of transactions and can even trace calls through multiple services. This also gives you more insight into when and where a problem occurred; however, you often need the detail of the logs to determine exactly why.
What DevOps teams need is a way to correlate logs and metrics to more effectively identify and analyze changes in application and host health.
Monitoring with Loggly and AppOptics APM
AppOptics APM allows you to collect, monitor, and analyze metrics from your applications and hosts. In addition, it lets you trace requests throughout your applications, view errors and exceptions, and monitor database queries. By recording metrics via AppOptics APM, you can create dashboards to visualize the state of your applications, monitor for changes in application performance, and create alerts.

Using AppOptics APM with Loggly lets you take advantage of metrics as well as the detailed granularity of logs. AppOptics provides visibility in your key performance indicators (KPIs) through alerts and visualizations, while Loggly provides deeper insights into the cause of problems. DevOps teams can use AppOptics to monitor for changes in application responsiveness or stability, then use Loggly to perform a more detailed root cause analysis.
How to Integrate AppOptics APM with Loggly
Before you can link AppOptics to your Loggly account, you will need to log in or create an AppOptics account and add your application or service to AppOptics. You will also need to make sure your application is sending logs to Loggly.
After logging into AppOptics, navigate to the Integrations page and enable Loggly under Hosted Services. Enter your Loggly subdomain in the box and click Save.

Now, when you select a host in AppOptics, you’ll see a link at the bottom of the Host Details card to View the Host Logs in Loggly. Clicking on this link opens a Loggly search for logs for the last hour containing the hostname. You can use the extensive searching and filtering tools of Loggly to further narrow down your search.
Troubleshooting a Failing Web App
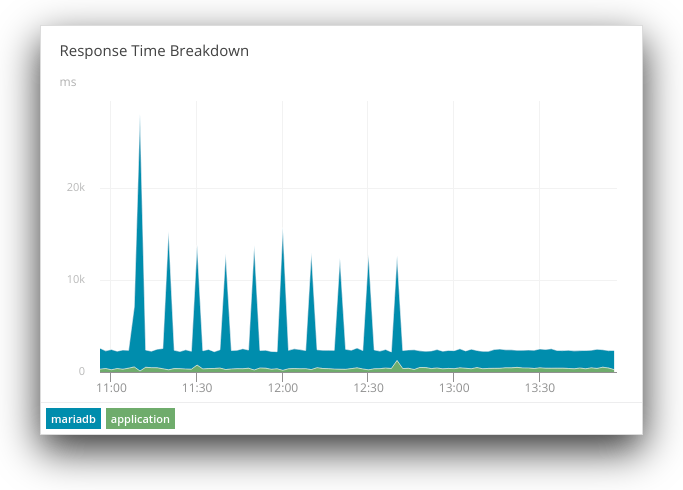
To demonstrate the power of metrics and logs, let’s take a look at a failing web application. The application is a Java servlet connected to a MariaDB database. When users send a request to the servlet, it runs a database query and returns the result. Recently, we’ve had a number of requests take several minutes to complete, most of which have ended in failures.
Looking at AppOptics APM, we can see the effect on the application’s response times and request throughput:

AppOptics provides a number of tools for monitoring performance, including the ability to trace database queries. Let’s take a quick look by clicking Traced Queries and clicking on one of the traces listed. As seen below, some of these traces are reporting timeout errors. However, we don’t yet know why these errors are occurring or why they’re only affecting certain queries.

Now let’s take a look at our logs. On the AppOptics APM dashboard, click on the host in the Top Hosts list and scroll to the Log Management section of the Host Details card. Click View Host Logs in Loggly to open the host’s logs in Loggly. This opens a Loggly search filtered to the host for the past hour.
Here, we can see a number of error logs corresponding to the errors seen in AppOptics. Looking at surrounding events shows us another trend that we couldn’t see in AppOptics: each error message immediately follows a message from the host’s cron service:

Cron is a service for scheduling the execution of commands on Linux hosts. In this case, cron is being used to execute a script (located at /home/debian/mysql/db-check.sh) at regular intervals (known as a cron job). It’s a maintenance script created by our operations team that checks, optimizes, and repairs the database using the myisamchk command. As it turns out, myisamchk locks each table as it scans it, forcing other processes to wait until the lock is released. Some of the larger tables can remain locked for several minutes, which causes our application to time out.
Running myisamchk on a live, production database is dangerous as it could lead to data loss, or in this case, have unintended consequences for other processes. The script may have been deployed to production by accident when it was meant for a testing or staging environment. Disabling the cron job drops the application’s response time back to its normal range:
Logs and metrics have their specific uses when troubleshooting performance problems. In this example, we were able to correlate metrics with a specific event, while still having the ability to leverage the strengths of each platform. We used metrics to identify a recurring trend in our application’s performance, and we used logs to narrow down the specific cause.
To prevent this problem from recurring, we could create an AppOptics alert that notifies us if our database queries are taking longer to complete than what our application’s query timeout period allows. We can also create a Loggly alert that monitors for database errors and sends the complete error message from our application to our operations team. Both of these tools handle different aspects of DevOps, and leveraging them together allows for a much greater level of observability.
Improve Observability with Loggly and AppOptics Integration
To start leveraging metrics along with your logs, sign up for a free 14-day SolarWinds AppOptics trial and follow these instructions to integrate SolarWinds Loggly with your account.
The Loggly and SolarWinds trademarks, service marks, and logos are the exclusive property of SolarWinds Worldwide, LLC or its affiliates. All other trademarks are the property of their respective owners.

Guest Author