Technical Resources
Educational Resources
APM Integrated Experience
Connect with Us
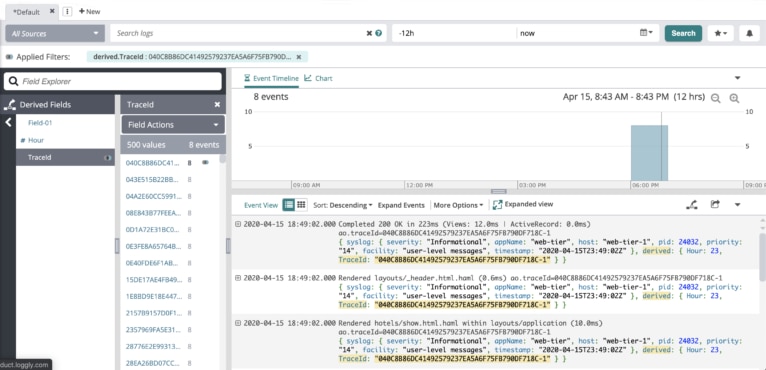
Stop hunting through systems to find relevant logs. Loggly provides a common trace ID that isolates logs to a specific transaction or request and creates a common view of impacted systems, event data, and stakeholders. With the common trace ID you can view events in context and rapidly pinpoint bottlenecks and failure points.
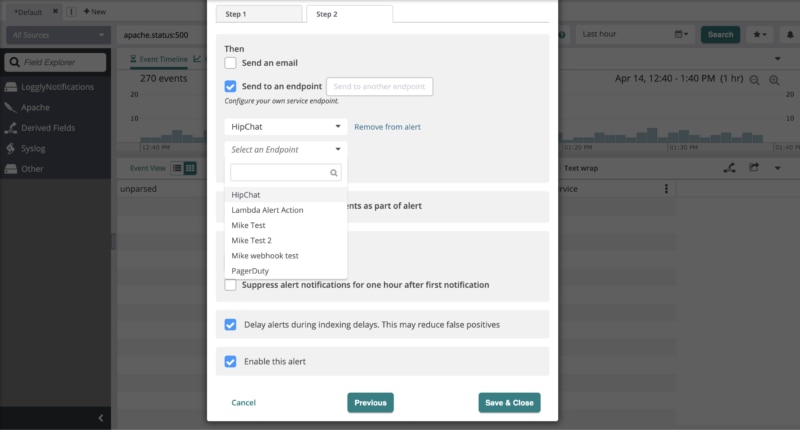
Send Loggly alerts to PagerDuty, Slack, Microsoft Teams, or any webhook-compatible notification service. Every alert comes with representative events and a link to the corresponding view within Loggly.
Monitor for a variety of conditions with alerts based on searches, thresholds for your log metrics, and other statistical measures.

Create and share interactive dashboards visualizing complex datasets and time-based dimensions. Control who can access and edit each dashboard.
Share insights from any view, search, or analysis you create in Loggly simply by sharing a link.
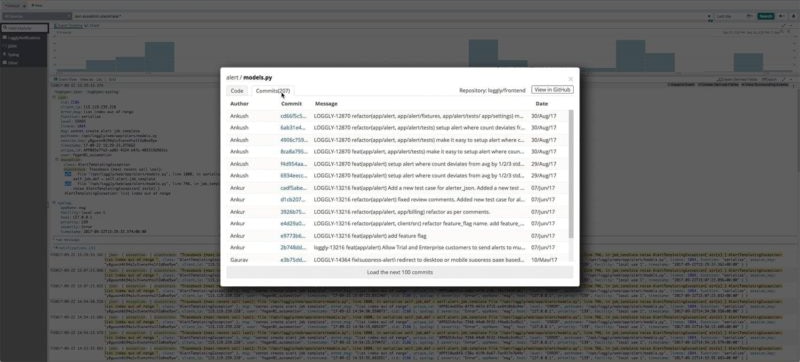
Loggly links your logs directly to the corresponding file and line in your source code from GitHub, using the filenames included in Java, JavaScript, or Python stack traces. You can connect to the right team member faster by viewing all of the recent commits.
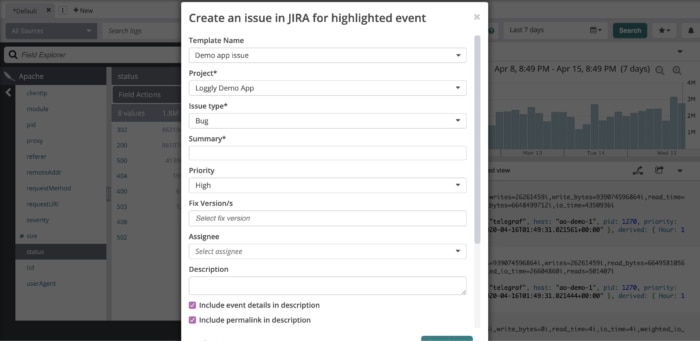
Increase your users’ productivity by filing Atlassian Jira or GitHub tickets from within Loggly. Add the appropriate information from your log data with a single click and accelerate the next steps with pre-populated fields.
With Loggly, filing a ticket involves a lot less context switching and copy-and-paste.

Anyone with more than six or seven microservices in production on more than 20 servers simply must centralize the log data.
Mohit Khanna Senior Cloud Architect, Datami
View app performance, system behavior, and unusual activity across the stack. Monitor key resources and metrics and eliminate issues before they affect users.
Trace issues down to their root cause. See how components interact across your stack, identify correlations, view source code, and share findings with your team.
Analyze and visualize your data to answer key questions, track SLA compliance, and spot trends. Loggly simplifies investigation and KPI reporting.
Our multi-tenant SaaS provides a secure, fast, scalable, and highly available solution to meet the highest standards while keeping TCO low.
See how to visualize your data with Loggly.