Technical Resources
Educational Resources
APM Integrated Experience
Connect with Us
In modern distributed setups, log volumes can rise rapidly and become unmanageable. Also, while the native Microsoft IIS log analyzer is useful, teams have to use multiple logging tools to monitor their infrastructure and applications.
When searching through massive log volumes in a distributed stack, common log viewers can get quite slow. The free IIS log analyzer doesn’t offer much help to teams when troubleshooting operational issues.
Teams need to perform a quick analysis and troubleshoot issues faster to reduce the impact of outages. However, they lack advanced tools and have to rely on open-source solutions that require complex configuration.
As a cloud-based SaaS solution, SolarWinds® Loggly® simplifies management of all types of application and infrastructure logs. Unlike free IIS web log analyzers, Loggly offers advanced features for indexing, parsing, organizing, and visualizing your IIS logs so you can solve your operational issues faster.
Loggly has an agentless architecture, which means you don’t have to install any proprietary agent to send logs to Loggly. You can send your IIS logs to Loggly via nxlog, which converts them to JSON format. Loggly also accepts a wide range of text-based structured/unstructured logs over Syslog (TCP, UDP, TLS) or HTTP/S.

Loggly can significantly improve your troubleshooting experience by simplifying several tasks. It supports a wide range of log types for automated parsing, meaning when you send your IIS logs to Loggly in the JSON format (which is a supported format), you can get them automatically parsed.
Loggly also helps ensure you get near-instant results for your searches across your distributed stack. Unlike other IIS log analyzers, Loggly offers a highly intuitive interface, making it easier to get better visibility into your logs. You can use the dynamic field explorer feature, which provides a guided search experience, filters out noise, and helps you quickly browse through the log data to find any recurring patterns or anomalies.

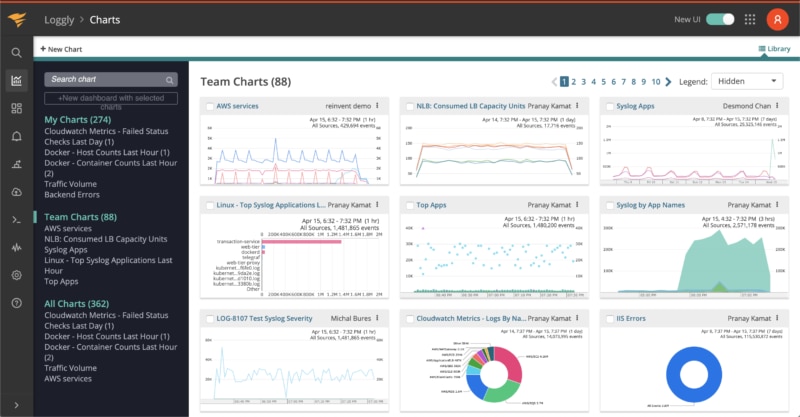
You don’t need to use a separate tool to visualize your logs. Loggly offers different types of charts to help you gather and present complex time-series data. Easily find trends and behavior over a period of time by comparing charts from a day or week before, using Timeshift. By combining multiple charts, you can build dashboards to monitor your applications and infrastructure over a single window.
You can also make use of the anomalies chart to find patterns that may remain undetected form your threshold-based alerts. Even better— Loggly eases collaboration as you can share your dashboard with your team members. You can also restrict access to edit dashboards and, in case you need to include information from a dashboard in a report, you can download it as a PNG.
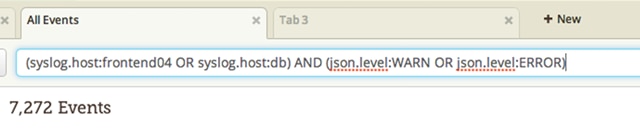
Loggly supports a simple query language based on Apache Lucene that helps you trim down your log data and focus on the parts that are most important. Use standard boolean operators such as AND, NOT, and OR to filter out unwanted noise, and create more complex queries using regular expressions. With the TO operator, you can even search for ranges of values in log messages, making it simple to find latency problems or messages containing any one of a wide range of HTTP response codes.
Loggly knows how to parse many common log formats, such as Apache, JSON, and Syslog, which means you can search for values in specific fields by specifying the field name, such as apache.status for HTTP status codes or syslog.host for Syslog hostnames.
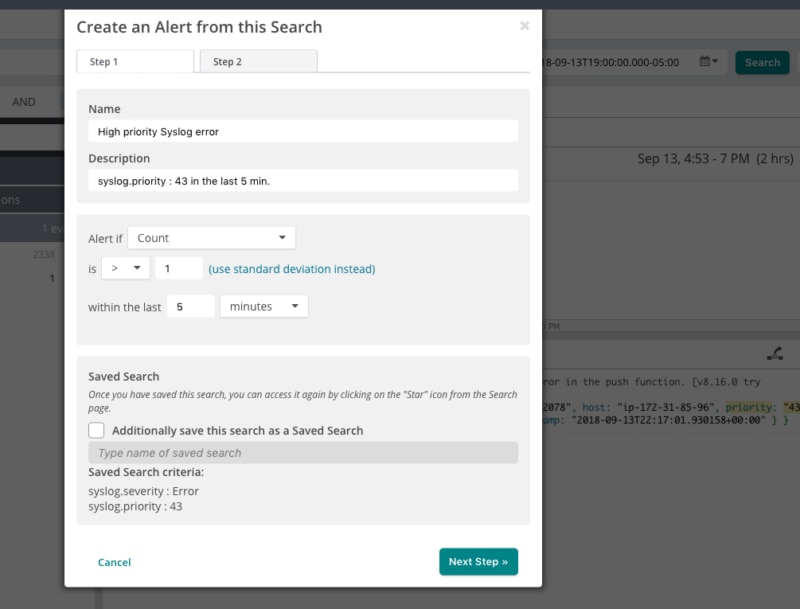
Manually running searches to monitor important metrics and KPIs simply doesn’t scale for busy teams. With the alerting functionality in Loggly, you can schedule your saved searches to run at a predetermined time and automatically get notified whenever your alerts trigger. The alert threshold feature enables you to configure how often a condition should be monitored as well as the number of events required to trigger an alert—which is handy for discovering spikes in latency and problematic metrics before your users notice.
Loggly also supports multiple endpoints for alerts, so you can direct the results of your saved searches to third-party tools such as Slack, Microsoft Teams, and PagerDuty. That way, you can be sure the right team member learns about the alert as soon as it happens.
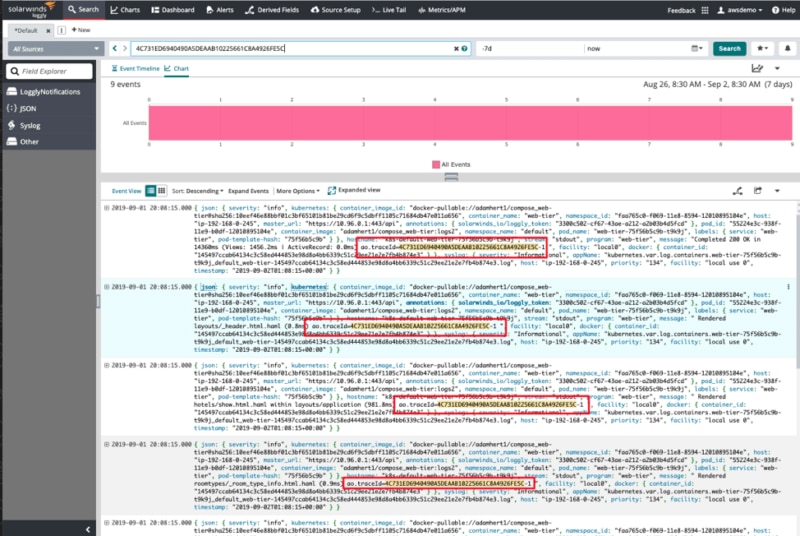
Tracking exceptions and error messages through huge log files to find the root cause can be cumbersome and time-consuming when you have no way to collect related messages together. Loggly integrates seamlessly with SolarWinds AppOptics™ and provides a shared trace ID which adds context to your logs and enables you to easily trace log messages across services.
Using the trace ID, you can find all log messages generated from a single request and diagnose complex problems. And because trace ID are propagated using HTTP headers, it doesn’t matter if your application is written using node.js, PHP, or some other language, you can take advantage of the AppOptics and Loggly integration and make troubleshooting both easier and faster. With the added context, you won’t have to guess which errors and exceptions are related to each other—you’ll know for sure.
Looking to expand your options? Try the SolarWinds SEM Microsoft IIS Log Analysis