Technical Resources
Educational Resources
APM Integrated Experience
Connect with Us
Most enterprises have a distributed setup with multiple servers, applications, and frameworks producing logs in different formats. Traditional Apache log analyzers may fail to handle this complexity.
Most log analysis software gets painfully slow when searching through large log files. This affects MTTR and can decrease application availability and uptime.
Teams have to configure multiple open-source tools for log aggregation, analysis, and visualization. All these tools can increase overhead and distract teams from their real work.
SolarWinds® Loggly® helps you solve log management challenges with a cloud-based setup for log aggregation, monitoring, and analysis. Keeping all your logs in one place allows you to get a unified, big-picture view of your distributed environment. Loggly can be set up in a few simple steps.
To send Apache logs to Loggly, you can use syslog daemons such as rsyslog. There’s no need to install any additional software as Loggly has an agentless architecture. The service can support your organization’s log retention policies at a fraction of the cost you would incur with a similar self-hosted logging setup.
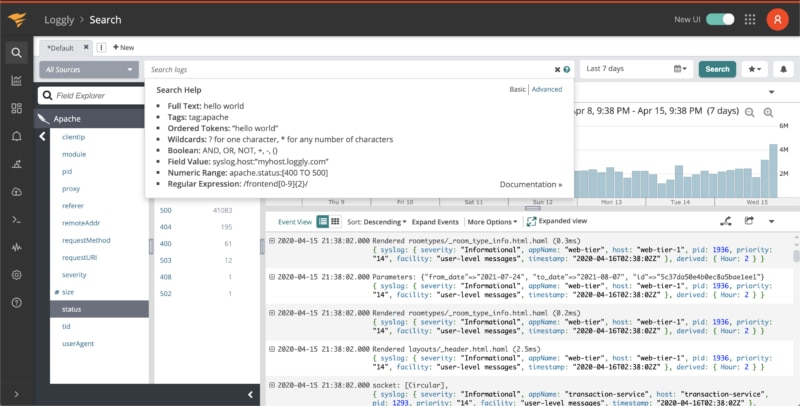
Loggly provides quick search results to your search queries, even when it has to search through a large volume of logs. It can automatically parse your Apache logs allowing you to run an advanced analysis using value fields, faceted search, filters, and more. You can easily inspect all events before or after a critical event with a single click.
Loggly offers an intuitive approach to analyzing your logs with its Dynamic Field Explorer™, which provides a structured summary of your parsed logs. It helps ensure you don’t have to start your search from a blank search page. Also, the Loggly GitHub integration speeds up troubleshooting by making it easy to find the relevant files and line of code.
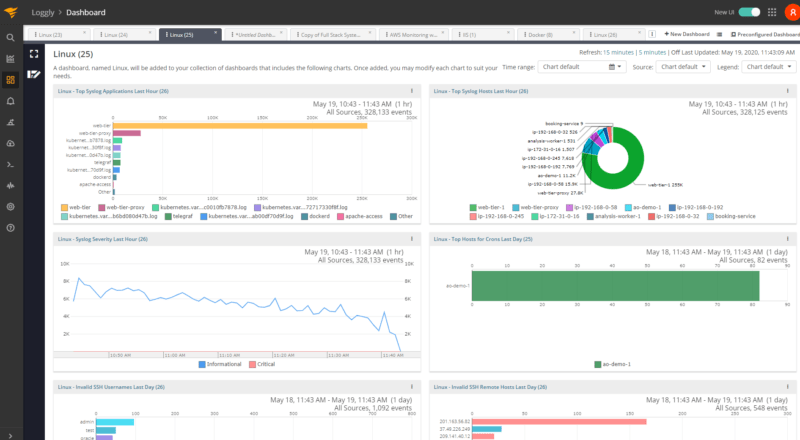
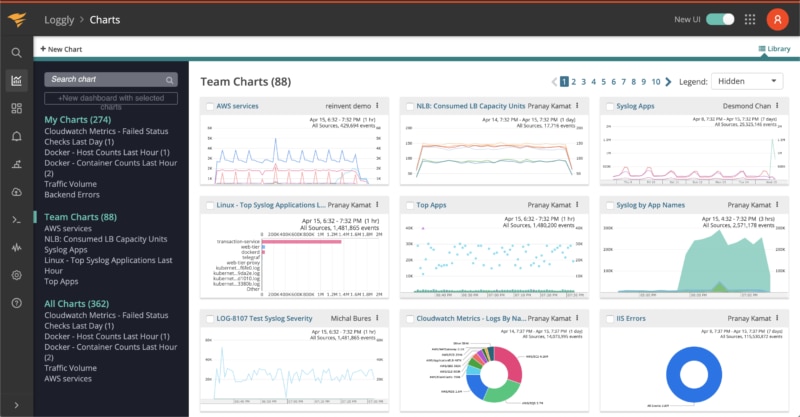
Loggly offers an out-of-the-box dashboard for monitoring the health and performance of your Apache servers. The preconfigured dashboard includes several charts that display key Apache metrics and indicators. You can customize it, drag and resize the charts, and share it with your team members for monitoring. You can also compare charts over a period using the Timeshift function or sync them to the same time frame with a single click.
The visual representation helps you easily spot any deviation from the normal. They’re also helpful in detecting hidden patterns before they cause any major damage. With proactive monitoring, you can significantly improve the performance of your Apache servers.
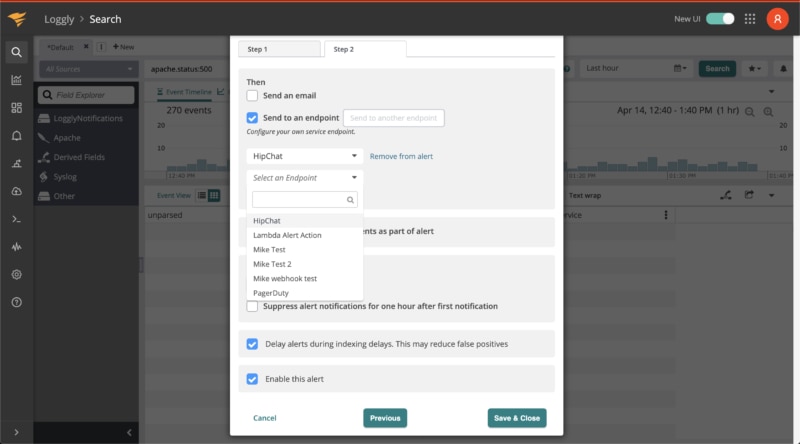
Manually running searches to check the health of your services simply doesn’t scale. Turn your saved searches into alerts and automatically monitor your web server without having to lift a finger. You can schedule alerts to run at a predetermined time and control how frequently they should run, and alerts thresholds allow you to specify the minimum number of events required to cause an alert to trigger; it’s a great way to help ensure the response times of your web server are within the limits of your SLA.
With alert endpoints, you can receive notifications using Slack, PagerDuty, and HipChat. Alerts can also be sent over email or to custom HTTP endpoints using POST and GET requests. And if you need even more information in your notifications, you can include the 10 most recent events.
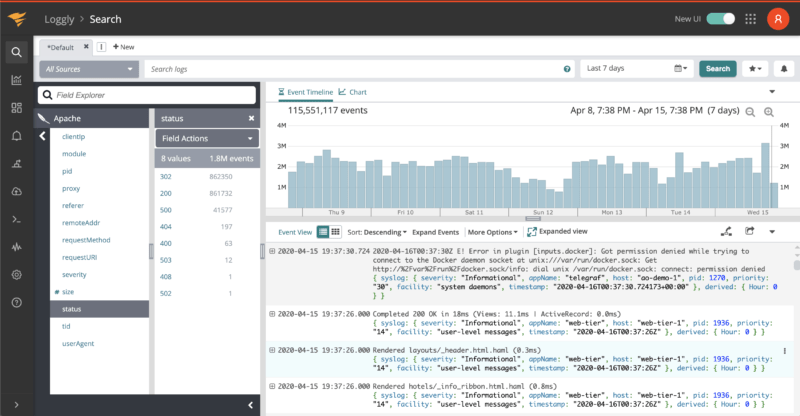
Accessing your log data quickly is only effective if you’re able to create queries that return the right data. Loggly supports a simple query language based on Apache Lucene which understands standard boolean operators such as AND, OR, and NOT. Additionally, you can use the TO operator to search for any log message containing values within a specific range.
The TO operator is handy for building complex search queries such as locating all messages that contain any of the HTTP response error codes or finding all messages that show high response times. If you need to restrict your search to a specific timeframe, you can use time ranges in your query to hone in on the right dates. Loggly also supports proximity matching for finding tokens within a certain distance of each other and fuzzy matching to locate a token within a given character edit distance.
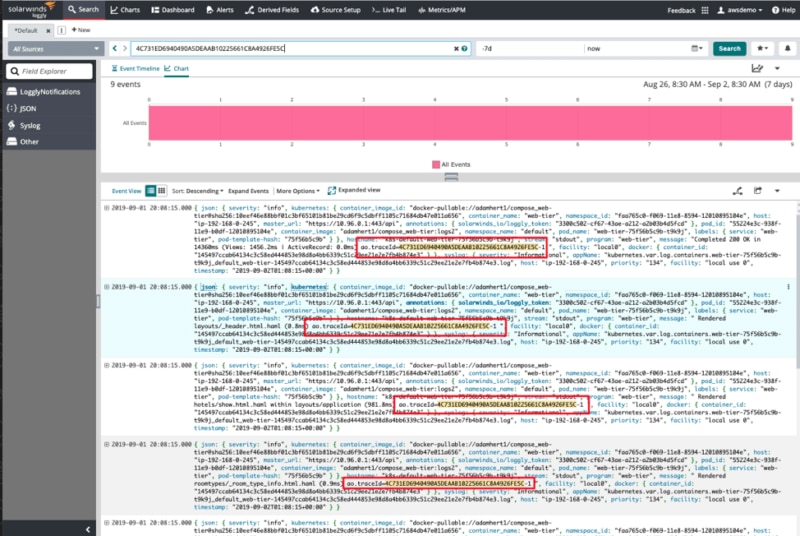
Tracing errors and exceptions throughout Apache logs is both time-consuming and usually based on guesswork. This makes it quite difficult to figure out which HTTP request was involved when the error occurred.
While it’s possible to implement a solution by using logging session IDs and API tokens, Loggly provides a better option. With the integration of Loggly and SolarWinds AppOptics™, you can automatically insert a shared trace ID into your logs, correlate log messages with HTTP requests, and quickly find the root cause of complex issues. The integration propagates trace IDs using HTTP headers, so no matter which language your app is written in, you can benefit from the additional trace context and simpler troubleshooting.
Looking for something else? You might also want to check out the SolarWinds SEM.