Technical Resources
Educational Resources
APM Integrated Experience
Connect with Us
In a production environment, it’s common to have multiple devices sending event messages to the syslog server. Analyzing all the logs in real time is complex and requires a centralized approach.
While browsing through large chunks of log data, it is difficult to find a specific log entry without using additional searching tool.
Usually, as per the syslog protocol, there is no defined way for messaging. Due to this inconsistency, it might be difficult to understand each syslog message.
With SolarWinds® Loggly®, a cloud-based centralized syslog viewer, you can send your data directly through syslog or by using Loggly’s HTTP API for custom applications. Those two methods let you aggregate all the logs in one place and visualize all your data.
Graphical format allows you to derive meaningful insights and quickly spot issues and anomalies. Loggly supports agent-free log collection, which uses syslog to manage log data and helps you obtain in-depth knowledge about your dataset without adding further load on the devices. Since it uses syslog rather than proprietary agents for log collection, Loggly is simple to set up and maintain.
Without any proper log analysis tool, administrating your data might become challenging and time-consuming.
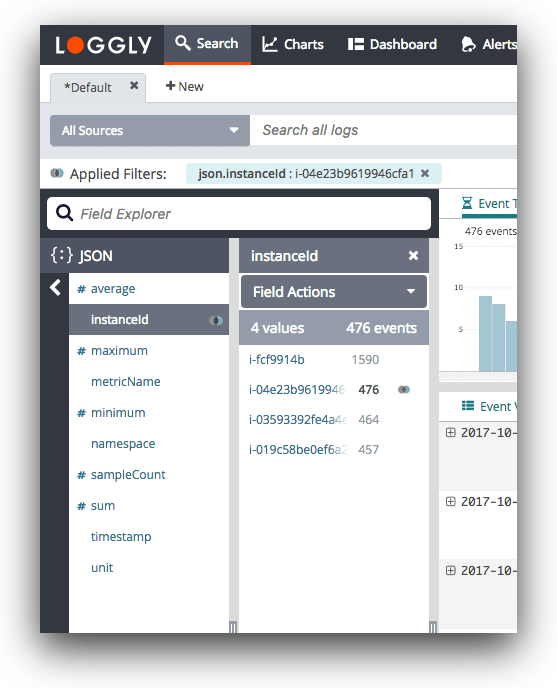
Loggly offers a comprehensive toolset offering advanced search, filtering, and charts to let you explore log data and find the primary causes of operational problems. Also, it gives you options for full-text and individual field searches using simple Lucene-like queries.
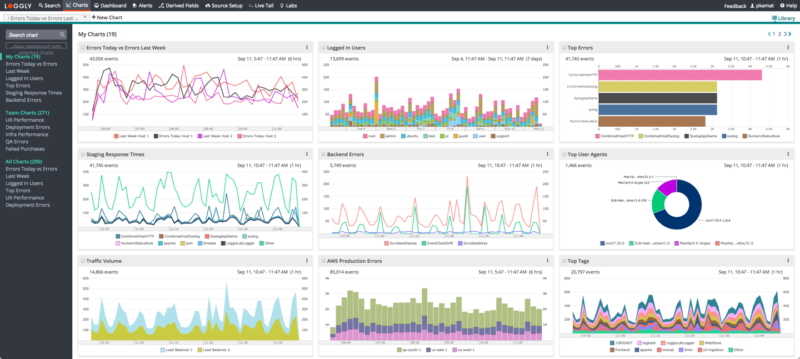
With charts and customizable operational dashboards from Loggly, you can quickly derive meaningful insights from the log data.
These visualizations might point you in the right direction while looking for hidden patterns and anomalies. The charts can be combined into unified dashboard and shared with your team to resolve issues collaboratively.
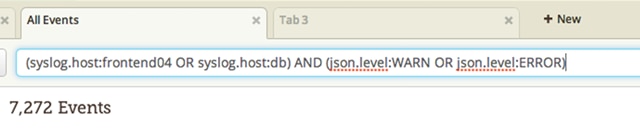
Navigating large log files is easy with Loggly and its intuitive search interface. Loggly provides a simple query language based on Apache Lucene that allows you to create search queries using standard boolean operators such as AND, OR, and NOT. Searching for ranges of values in log messages is also possible thanks to the TO operator, which provides a handy way to search for all Apache log messages containing any HTTP response error code or all messages showing a transaction latency above a specified threshold.
If you need more ways to express your search query, you can use proximity matching to search for tokens within a certain distance from each other or use fuzzy matching to find tokens within a specific character edit distance.
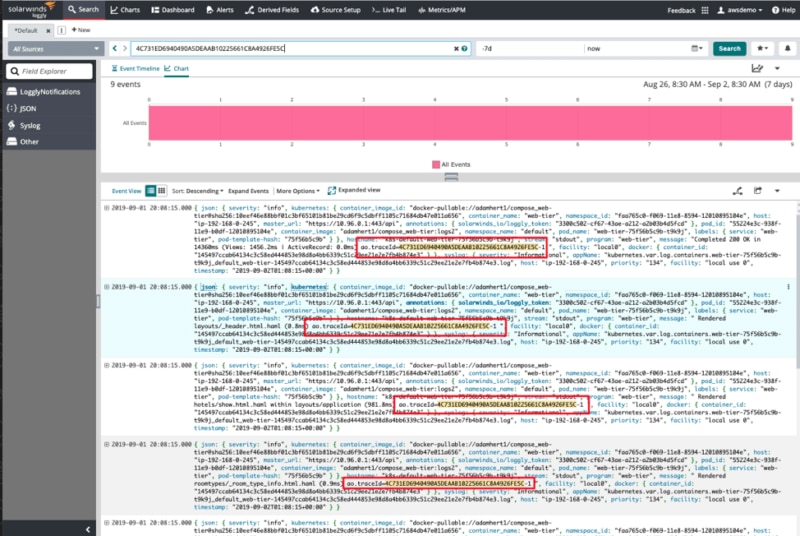
Correlating exceptions and errors with application requests is problematic in large log files, and often involves basing your analysis on assumptions and best guesses. And while it’s possible to create your own solution using API tokens and logging session IDs, that’s both time-consuming and requires making changes to your app. Loggly and SolarWinds AppOptics™ integrate seamlessly to provide additional trace context in your logs and make matching related messages easy.
AppOptics uses a shared agent design to automatically insert a trace ID into your logs, making it simple to track exceptions and error message across services by propagating the trace ID using HTTP headers. And that means you don’t need to modify your code or change your infrastructure to take advantage.
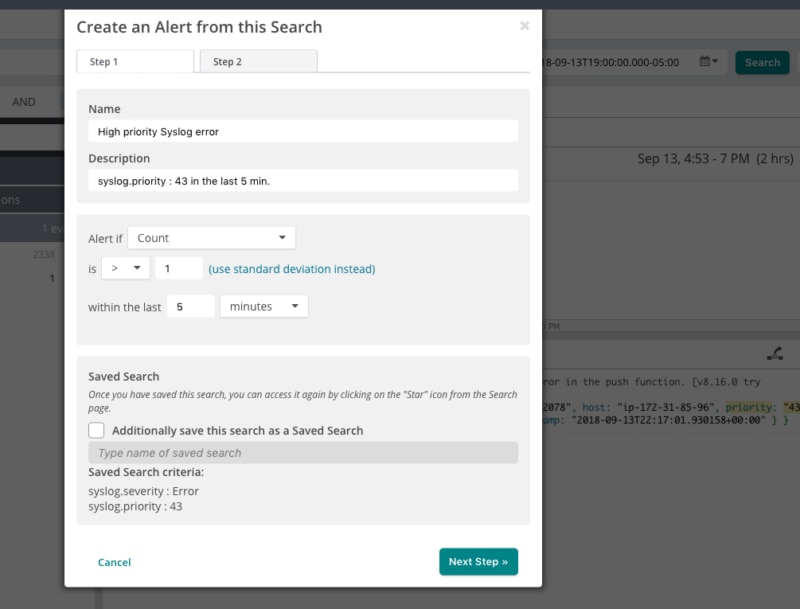
Manually searching through your logs to monitor your infrastructure simply doesn’t scale. Loggly lets you schedule your saved searches to run at a predetermined time and assign alert thresholds to control how many events need to be seen before triggering an alert.
You can direct the results from an alert to a number of alert endpoints such as Slack, HipChat, and PagerDuty, and a variety of other collaboration tools. And of course, you can always send alert results over email or as a JSON object to a custom HTTP endpoint using GET and POST requests. Whichever option you choose, using alert endpoints will help ensure you know about traffic spikes and drops in throughput before your users do.
On the hunt for more? Don’t forget to visit the SolarWinds Kiwi Log Syslog Viewer