Technical Resources
Educational Resources
APM Integrated Experience
Connect with Us
If your business is spread across multiple geographies and has region-specific configurations in CloudWatch, you know it’s not easy to combine metrics from different regions within an AWS monitoring tool.
SolarWinds Loggly can help you solve for this complexity. You can send logs and metrics from CloudWatch and CloudTrail to Loggly and unify these logs with other data for a better understanding and quicker troubleshooting of your infrastructure and applications. Sending CloudWatch logs and metrics to Loggly is easy; there’s nothing to install. Loggly is extremely flexible and supports downloading objects you create in Amazon S3, as well as uncompressed line-separated text files from AWS, including the logs from ALB, ELB, and CloudFront.

Loggly integrates with Amazon CloudWatch to help you harness the true value of your log data and help ensure comprehensive AWS network monitoring. It provides interactive features to improve your log monitoring experience. You can use the powerful search to sift through large volumes of logs quickly.
Loggly provides automated log parsing, allowing it to provide near-instant search results. The Loggly Dynamic Field Explorer™ provides a structured summary of your parsed logs. This view is like a map of your data and can help you instantly spot anomalies and home in on trouble spots. To dig deeper, you can use the powerful search capabilities in Loggly, without having to learn proprietary query languages.
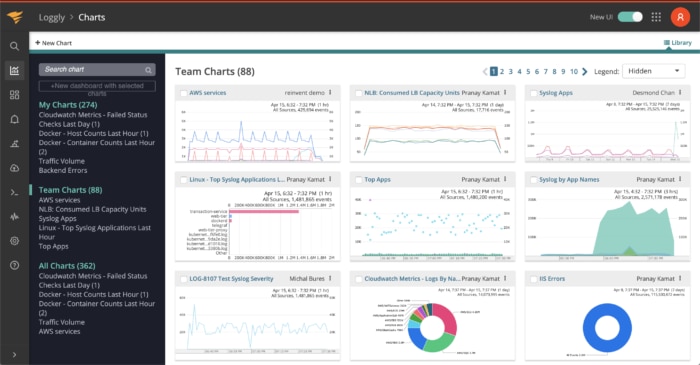
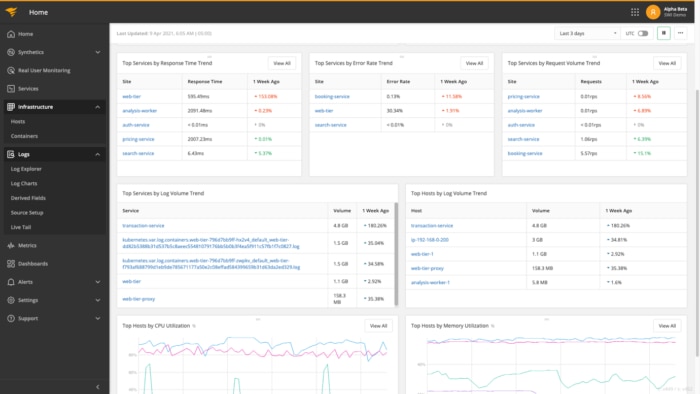
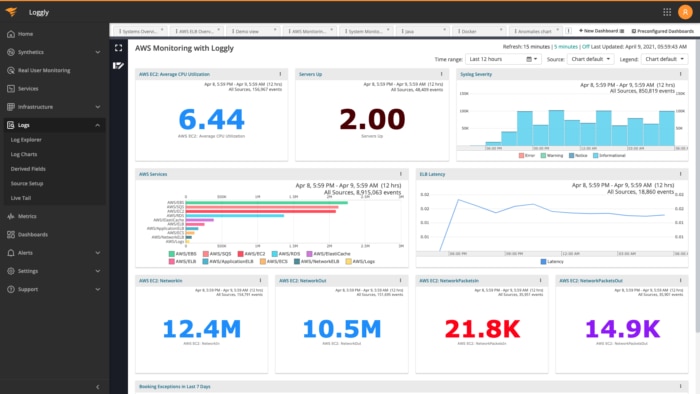
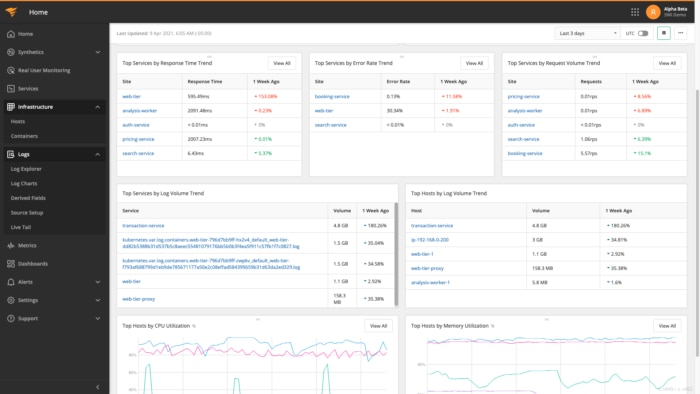
As an AWS monitoring solution, Loggly offers dashboards and alerts designed to track multiple metrics and performance indicators within your logs. It generates real-time, navigable log summaries and interactive charts for detailed view into your AWS environment.
Click on any spike in the chart to find associated logs and drill down into the logs to pinpoint the root cause of issues within your infrastructure and applications. Unify AWS log data with performance data in the Loggly dashboards to get a holistic view of your environment, allowing you to identify trouble spots early and avoid outages or service degradation.
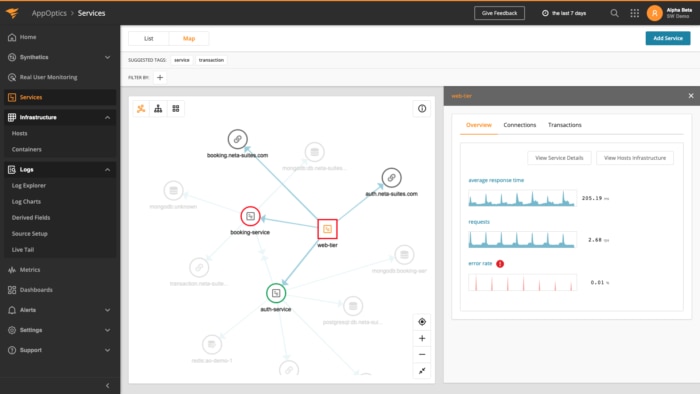
AppOptics is a robust analytical solution with comprehensive visibility, code-level monitoring, and distributed tracing for fast and accurate troubleshooting. It drills down into hundreds of AWS metrics and utilizes multi-dimensional filtering to identify the root cause of issues, hot spots, outliers, minimize downtime, and enhance the end-user experience.
The monitoring tool includes 150+ integrations and plugins along with 30+ AWS services. AppOptics helps in monitoring AWS databases, CDNs, virtual servers, and more. It performs full-stack analysis, view time-series data, response times, trace requests, and more.
While Loggly offers a quick analysis of AWS application logs from distributed sources, AppOptics provides code-level visibility into AWS application performance metrics. Together, these tools offer full-stack AWS monitoring with a wide variety of infrastructure and time-series metrics such as CPU utilization, network metrics, and more.
This integrated application performance monitoring (APM) suite also offers advanced features such as live code profiling, exception tracking, and unified AWS service dashboards. With these features, teams can gain deeper insights required to understand an application’s performance and troubleshoot issues quickly and effectively.
Looking for something else? You might also want to check out the SolarWinds SEM