Technical Resources
Educational Resources
APM Integrated Experience
Connect with Us
Traditional log viewers require teams to set up their own servers. Managing this infrastructure in an environment where logs multiply at incredible rates can be highly resource-intensive
In a distributed environment, teams can struggle to identify the correct server for troubleshooting and might have to log into multiple servers to follow a trail. Log file readers do little to resolve this complexity.
Most log viewer tools offer limited features for data visualization, sharing, and reporting of data. This makes it tough for teams to collaborate and find patterns hidden in log data.
SolarWinds® Loggly® offers cloud-based log management that helps you gather logs from different apps, endpoints, infrastructure, and clouds in one place with a quick setup. This simplifies troubleshooting across your application and distributed infrastructure.
In addition to providing the immediate benefits of cloud-based centralized management in terms of scalability, ease of provisioning, and costs, Loggly also offers a highly interactive, responsive, and smart interface. By offering better usability, Loggly makes the daily grind of your DevOps teams less taxing than ever before. Furthermore, moving logs to Loggly doesn’t require any proprietary agents; your teams can accomplish this using syslog or any other log source of their choice.
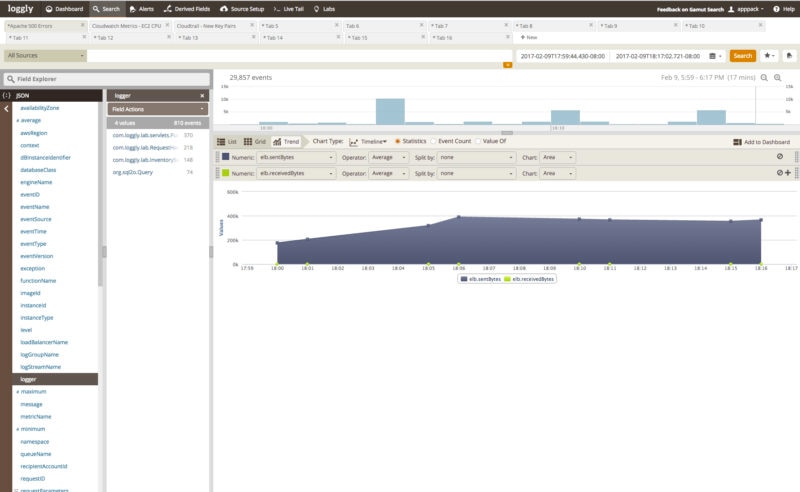
Loggly is built for modern workloads, which means it takes no time for you to extract relevant information from massive volumes of log data spread across your distributed stack. Whether it’s about viewing real-time events or browsing through past data, Loggly provides an immediate response to your search queries. In fact, you don’t have to learn a proprietary query language for these searches; you can use regular expressions or search by individual fields, booleans, range, and more.
Loggly’s Dynamic Field Explorer is another interactive feature which structures all your log information into different categories, automatically. This allows you to click and browse through the logs, detect anomalies, and resolve issues faster.
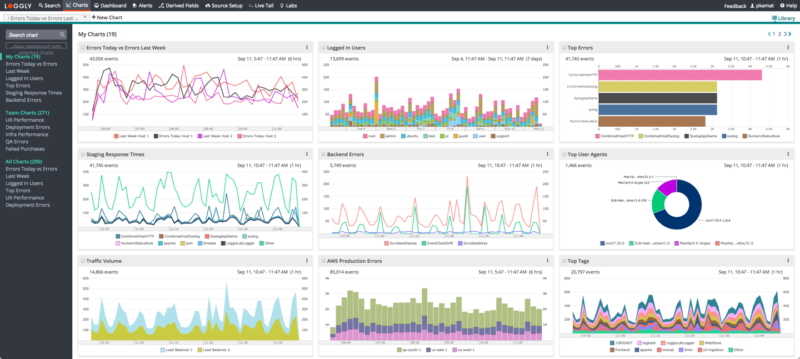
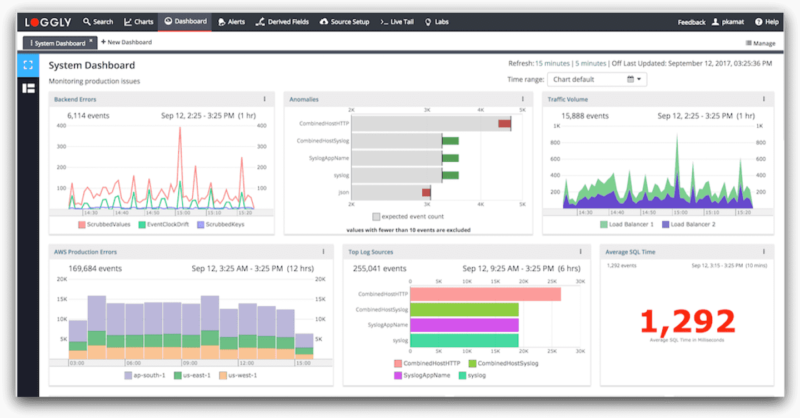
Loggly makes it possible to unify log data from all your sources and convert this data into graphical charts. These charts simplify application and infrastructure monitoring by allowing you to view key trends over a period with the timeshift function.
Furthermore, Loggly’s anomaly chart helps you resolve issues proactively, by letting you detect potentially problematic events in advance. Many of these trends can otherwise go unnoticed as traditional count-based threshold alerts may not trigger in these cases. You can incorporate these charts with interactive and shareable dashboards. The dashboards provide a command-center view to your team, helping them take stock of events and activities across your entire stack.
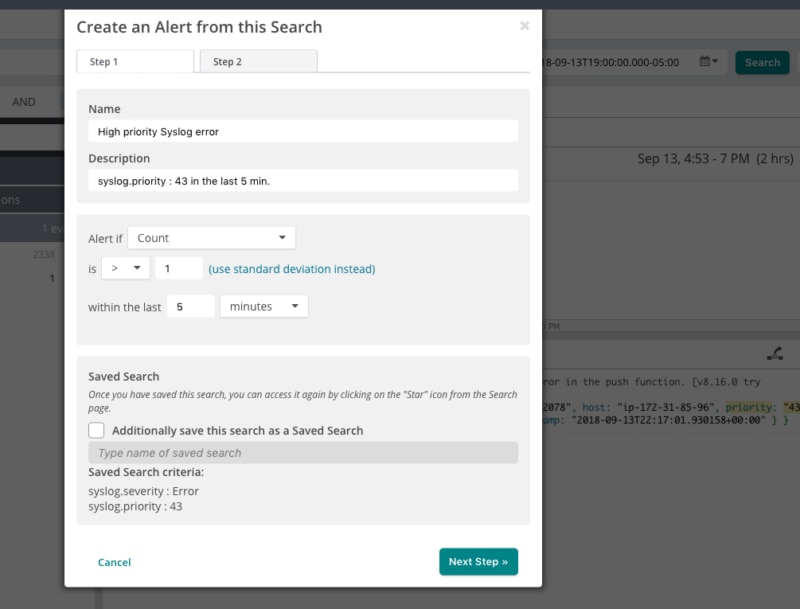
Manually running saved searches to check metrics and key events simply doesn’t scale for busy teams. Loggly can monitor things for you with its built-in alerting feature. You can schedule your saved searches to run at a predetermined time and completely remove the manual work from monitoring.
If you need to watch out for runaway conditions or events that should not exceed a given limit, you can assign a threshold to an alert and control how often a metric should be monitored and how many events need to be seen before an alert is triggered. When an alert fires you can route the results to a variety of destinations using alert endpoints. Loggly supports alert endpoints for many popular tools including Slack, PagerDuty, and GitHub. And of course, you can send alerts via email as well.
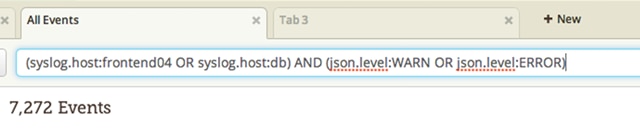
The search query language supported by Loggly is based on Apache Lucene, and provides you with a range of features for finding and selecting the log messages you need. Use boolean operators, numerical ranges, time ranges, and powerful regular expressions, to find the correct log messages you need to troubleshoot issues.
Loggly can automatically parse and view a range of log file formats, which means you can use field names in your queries to create simple but intelligent searches. And if that wasn’t enough, the Loggly search query language also supports proximity and fuzzy matching features, inspired by Apache Lucene, which allow you to search for tokens within a given distance.
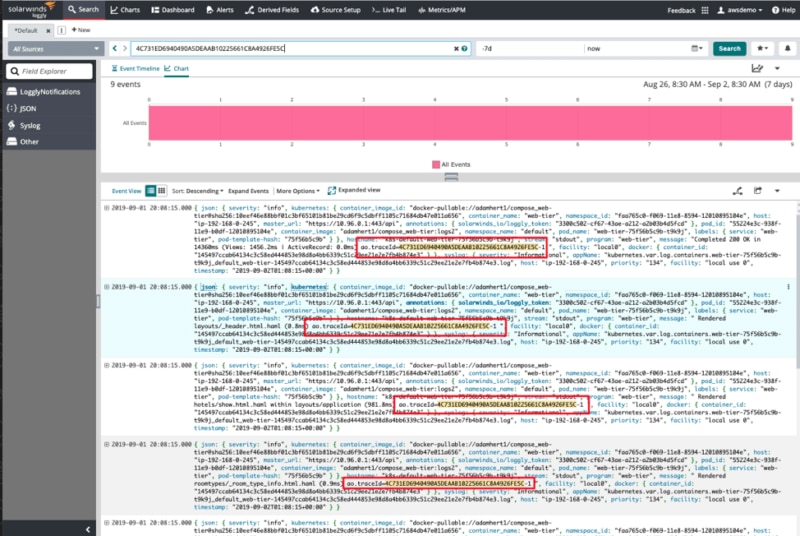
Understanding how performance issues and errors occur and connecting log messages together by staring at huge log files can be incredibly time-consuming. Loggly and SolarWinds AppOptics™ integrate with each other to provide a seamless application performance monitoring (APM) solution by adding trace context to log messages. AppOptics inserts a shared trace ID into your log data, allowing you to see at a glance which log messages were generated from the related application trace.
In busy log files with thousands of messages per minute, this additional trace context can help you narrow in on the exact messages related to the performance issue you’re investigating, allowing you to quickly find the origin of exceptions and error messages. No matter where your logs are generated, the integration of AppOptics and Loggly lets you piece together all the performance metrics AND events to significantly reduce mean time to repair (MTTR).
Need more options? Don’t miss the SolarWinds Log Visualization