Technical Resources
Educational Resources
APM Integrated Experience
Connect with Us
Collect all your Azure application logs in one hosted and managed location for an easily searchable view of what's happening.
Fast, interactive searching provides answers to key questions and helps you track SLA compliance and spot trends.
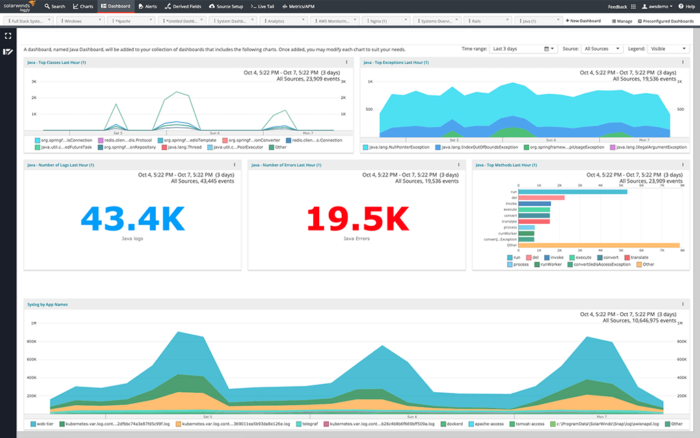
Create charts and dashboards relevant to your specific Azure environment, or use preconfigured dashboards to share with your team.
Create alerts based on search patterns, thresholds for specific log metrics, or other business-specific conditions.
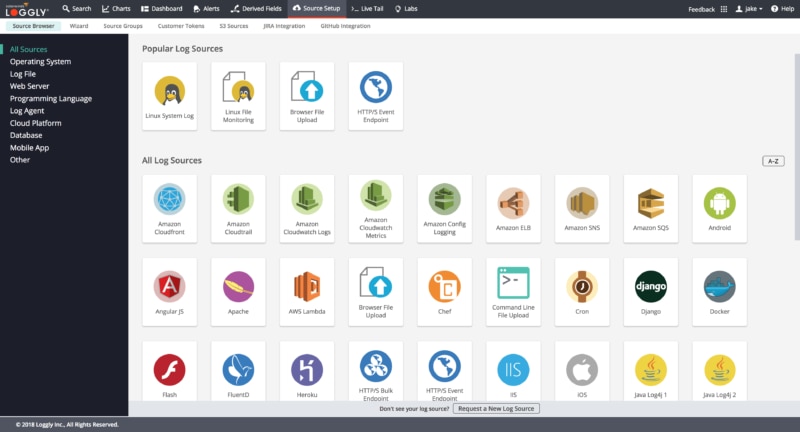
Aggregate parsed log files to one easily searchable location for log monitoring and troubleshooting. Loggly is a pure SaaS-based service that makes setup simple and scales with your needs. Any log data from any system can be collected, and, since Loggly uses open standards to transfer this data, there is no dependency on proprietary agents. If it logs, it can log to Loggly.

Experience near-instant responses for searches over massive data volumes and long time periods. Analyze the entire range interactively. The Loggly® Dynamic Field Explorer provides a structured summary of all your parsed logs, like a map of your data. Surround search shows you what happened across the stack, at the same time as a chosen event. And you can use Livetail for near-real-time monitoring. Open a pre-populated Jira ticket with one click, or click right to the problematic line of code in GitHub.

Use charts and dashboards to connect the dots across your web applications, infrastructure, and devices with a unified view across log data. Create your own dashboards from relevant charts, or use preconfigured dashboards that provide immediate, effective views of performance and usage of your various systems, helping you reveal what matters most in your logs. Open a pre-populated Jira ticket with one click, or click right to the problematic line of code in GitHub.
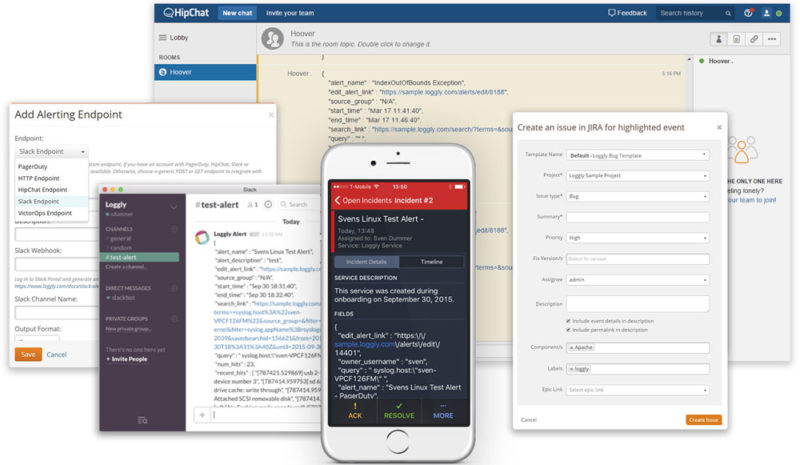
Loggly alert monitoring covers a variety of conditions based on searches, thresholds for your log metrics, and other statistical measures. Work better as a team using data and analysis with DevOps tools. Loggly integrates with Slack, GitHub, Jira, PagerDuty, Microsoft Teams, custom webhooks and more.