Technical Resources
Educational Resources
APM Integrated Experience
Connect with Us
In a distributed environment, keeping track of several logs from different applications, servers, and the cloud can be challenging. As teams lack a reliable logging setup, logs often spiral out of control.
Some of the Heroku application logs are extremely verbose by default, making it difficult for teams to analyze them. Traditional tools also take up much time to parse, search, and analyze Heroku logs.
Team lack tools that offer advanced capabilities for visual analysis of logs. To find workarounds, they have to rely on open-source tools, which can pose several configuration challenges.
SolarWinds® Loggly® helps you simplify log management and enhance correlation and analysis. With all your Heroku application, system, and router logs in one place, you can troubleshoot issues with minimal effort. Setting up Loggly is simple as it doesn’t require the installation of an agent.
You can start sending the logs to Loggly using Heroku log drains. You can also collect your other application and infrastructure logs on Loggly to unify all your log monitoring and analysis work. Further, once your logs get past the retention period, they are automatically archived on AWS S3 buckets.

Loggly can significantly boost your troubleshooting speed with its powerful search performance and intuitive features for log analysis. You can monitor, search, and tail Heroku logs with your browser, CLI, or an API. It offers near-instant results to all your search queries and can automatically parse Heroku logs. You can check Heroku logs easily using the Loggly dynamic field explorer, which structures all your logs under various fields and use filters to view specific information.
With Heroku router logs, you can monitor latency over a period and take remedial actions to resolve potential issues with your infrastructure, database, or code. Loggly also allows you to configure intelligent alerts for specific thresholds or errors to resolve issues proactively.

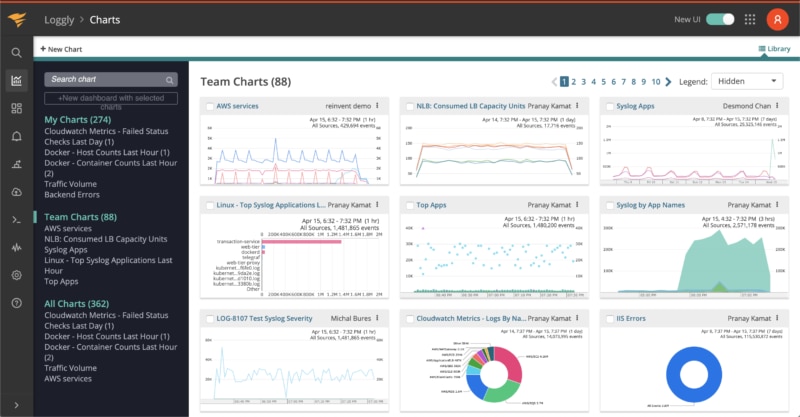
Loggly makes it easier for you to view Heroku logs with a pre-configured dashboard that includes various charts for displaying key performance and usage statistics. You can sync all the charts in the dashboard with a single click. With this dashboard, you can easily spot an anomaly or a recurring pattern, and take necessary actions to resolve issues in time.
You can also customize your dashboard and share it with your team to keep everyone on the same page. It is also possible to download a dashboard in the form of a PNG image, in case you want to include it any of your reports. With all of the above and many other interactive features, Loggly adds significant agility to your log analytics, management, and search tasks.
Still searching? You may be interested in the Solarwinds SEM