Technical Resources
Educational Resources
APM Integrated Experience
Connect with Us
In large organizations, teams have to handle logs from a wide range of endpoints, servers, applications, and the cloud. Staying on top of all this data along with NGINX logs becomes difficult.
Traditional NGINX log file analyzers aren’t built to handle modern workloads and can take a great deal of time to provide results for normal search queries. This can frustrate teams and reduce efficiency.
Teams have to rely on multiple open-source tools for log aggregation, analysis, and visualization. These tools pose several configuration challenges.
SolarWinds® Loggly® simplifies log aggregation, monitoring, and analysis offering a cloud-based service which can meet your varied logging needs. With all your logs in one place, you can centrally monitor and correlate log data to stay on top of your distributed environment.
Unlike other logging tools, Loggly is built for simplicity, speed, and scale. It offers a quick setup with minimal configuration to get you started. There is no need to install an agent for collecting logs from different sources. You can use syslog daemons such as rsyslog to send NGINX logs to Loggly. Further, Loggly reliably archives your logs on AWS S3 once they have gone past the log retention period.
Traditional NGINX log analyzers can impede troubleshooting as they take much time to process search queries whenever there’s a large amount of log data. On the other hand, Loggly always offers quick results for your search queries. It can automatically parse your NGINX logs to help you analyze data under different fields.
The Loggly dynamic field explorer prevents you from running random trial and error searches by providing a guided search experience. You can filter out the noise and hone into specific information to get to the root cause of issues. Further, Loggly allows you to inspect all logs surrounding a critical event with its surround search feature. With all these attributions, you can analyze log data easily and reduce your time to resolve issues.
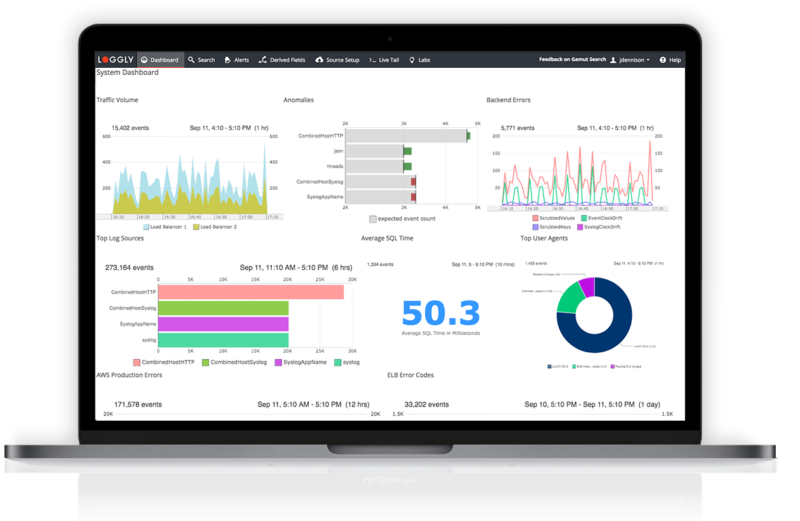
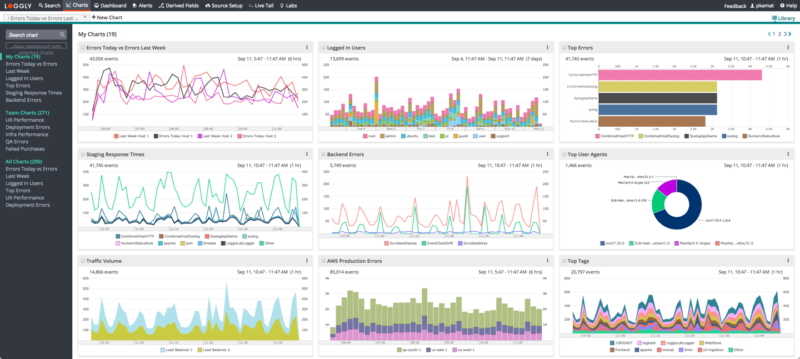
Loggly helps you concentrate on your log analysis and troubleshooting work with several advanced integrations under the hood. You can use a pre-configured dashboard for monitoring key NGINX statistics, without any need to set up complex visualization tools. This dashboard allows you to easily spot a spike in 4XX and 5XX status codes which can be a sign of a problem within your application.
By inspecting similar anomalies and events, you can drill down to resolve issues proactively. Moreover, Loggly integrates with GitHub, Jira, and notification services like Slack, HipChat, PagerDuty, and more. All these integrations allow your team to collaborate seamlessly and stay on top of your environment with unified monitoring of logs.
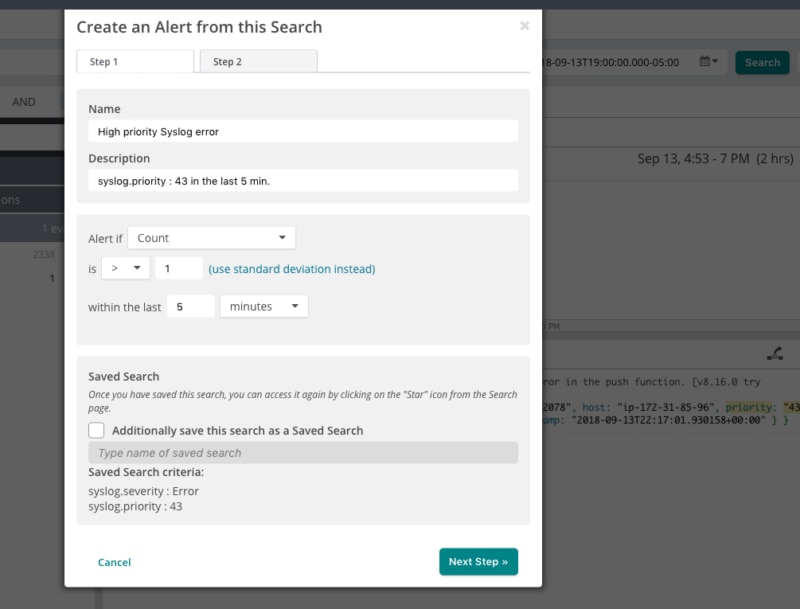
Discovering issues and patterns in your NGINX logs with manual searching is both time-consuming and distracting. With Loggly alerts, you can schedule your saved searches to run at a predetermined time and with a specific frequency. Alert thresholds allow you to control the number of events needed before an alert is triggered, which is handy for implementing warnings when traffic spikes or response latency exceeds acceptable limits.
Alert notifications can be sent over email or to custom HTTP endpoints using GET and POST requests. Loggly alerts also support third-party collaboration tools such as Slack, HipChat, and PagerDuty. So no matter which tools your team uses to stay up to date, you can be sure the right people will know about issues before your users do.
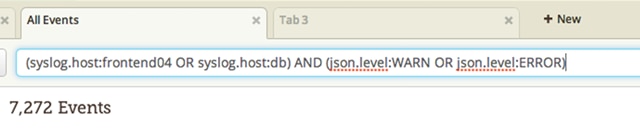
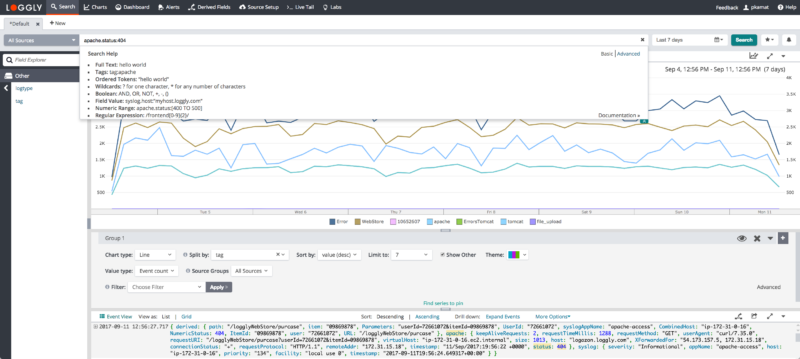
It doesn’t matter how quickly you can get search results if you struggle to create the right query. Loggly supports a simple query language, based on Apache Lucene, that helps you create simple queries using standard boolean operators such as AND, OR, and NOT.
The language also supports the TO operator, which allows you to search for log messages matching a range of values. This feature is great for finding all NGINX messages containing any of the range of 4xx and 5xx HTTP response codes, or for finding requests with higher than expected latency. You can also restrict the scope of your search using time ranges, which makes it straightforward to inspect logs from last week or last month.
Following errors and exceptions throughout your logs to find their origin is tricky with large NGINX log files, and it’s often based on best guesses and assumptions. And to make things worse, it’s even harder to map those exceptions to the individual requests that triggered them.
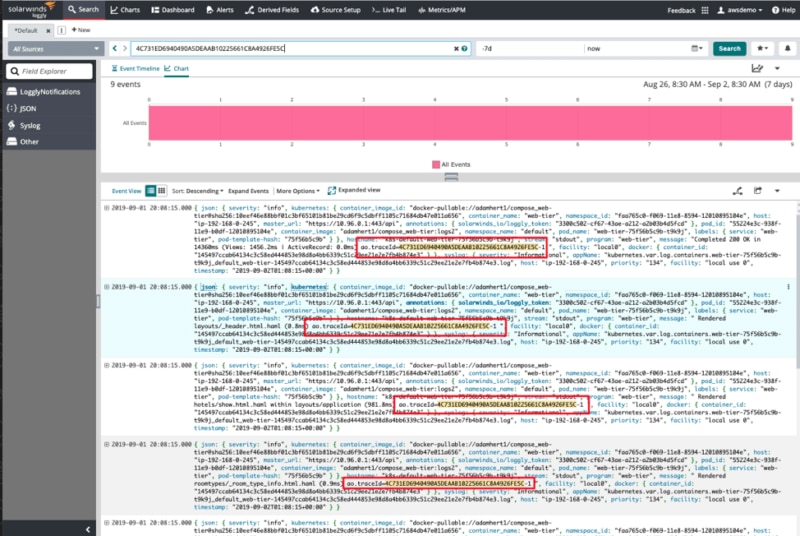
With the seamless integration of Loggly and SolarWinds AppOptics™, you can use additional trace context to identify related log messages and easily figure out which request they belong to. The integration automatically inserts a trace ID into your logs, enabling you to debug complex NGINX performance issues with ease. Once you’ve located the trace ID you want to follow, you can use the trace view in AppOptics to jump to Loggly and dig into the low-level details.
Want something different? Try the SolarWinds Apache Log Analyzer