Technical Resources
Educational Resources
APM Integrated Experience
Connect with Us
Managing a massive volume of logs from different frameworks is challenging and time-consuming. Traditional Javascript logging setups may not be capable of handling it properly.
Most Javascript loggers offer limited features for search, tail, and log analysis. This extends the time needed to be dedicated to the task and enhances engineers’ effort in troubleshooting.
Developers have to integrate multiple open-source tools with their Javascript logging service for visualization, which can pose configuration challenges.
In distributed setups with multiple Javascript frameworks and applications, the log management becomes challenging. SolarWinds® Loggly® solves this problem by offering a cloud-based logging setup. In addition to Javascript, you can forward all types of logs to Loggly for a unified analysis.
This centralization of log data not only solves the storage challenges, but also allows you to troubleshoot issues at an increased pace. Loggly has a simple setup and an agentless architecture which makes sending logs to Loggly easier. You can use a simple script loggly-jslogger for this purpose, or apply other methods as described here
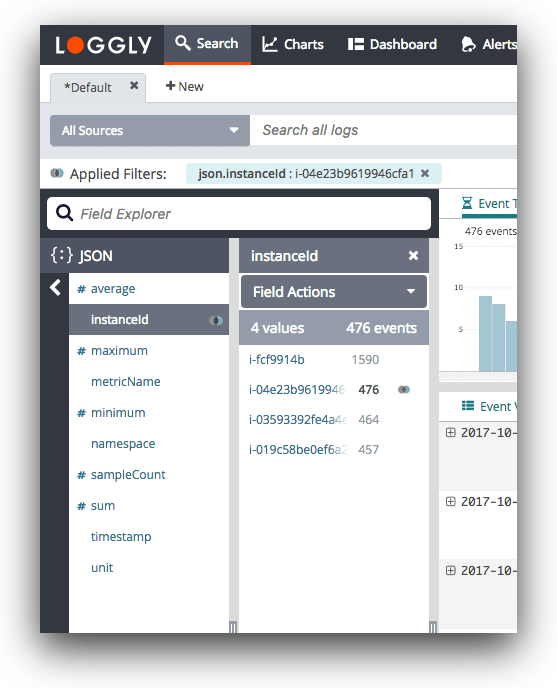
Unlike other Javascript loggers, Loggly provides you with advanced features for faster and better troubleshooting. It automatically parses every Javscript log and provides a structured summary of logs using a Dynamic Field Explorer. With this feature, you don’t have to start your log search from a blank console.
Instead, you can click and browse through your logs to extract useful information. The tool can significantly reduce the time spent on troubleshooting. Loggly also offers near-instant results to all your log searches, which is a huge advantage as most tools might slow down when the log volume increases.
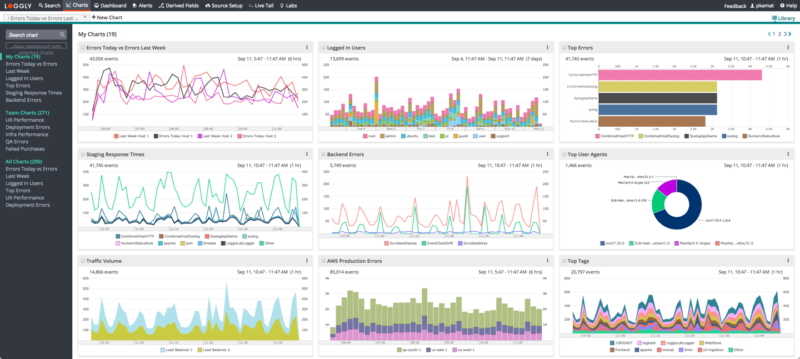
Loggly is built to improve interactivity and collaboration. You can use integrated charts to visualize your search results. The charts can be grouped together and resized using the drag and drop feature to create unified dashboards.
You can share the visualized data with your team members, and project the dashboard over a larger screen for a command-center view. Loggly also integrates with notification services like Hipchat and Slack for alerting. Its integration with JIRA and GitHub improves collaboration between team members and helps them resolve issues faster.
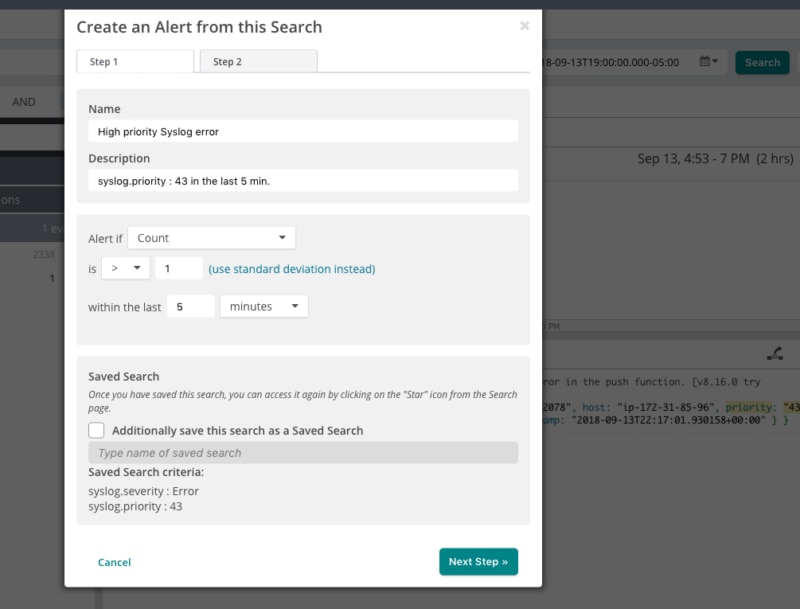
Loggly allows you to turn your saved searches into alerts so you no longer have to monitor your app and infrastructure with manual searches. With alerts, you can schedule them to run at a predetermined time and control how often the alert condition should be checked. Alerts are a great way to implement monitoring for response times and to be notified whenever they rise above your SLA limits.
Get notifications whenever an alert triggers by using one of the many alert endpoints Loggly supports, including Slack, PagerDuty, and GitHub. And of course, you can always receive notifications over email or send them to custom HTTP endpoints using POST and GET requests. With support for alert endpoints, you can be sure the right team will know about issues before your customers do.
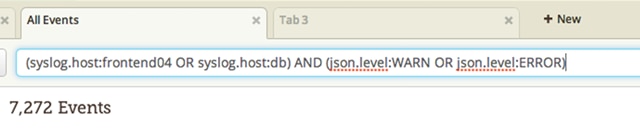
Because Loggly is a cloud-based JavaScript logging service, your log data can be retrieved nearly instantaneously. To make sure you’re getting the log data you need, Loggly supports a simple query language based on Apache Lucene. With it, you can create search queries using standard boolean operators such as AND, OR, and NOT. The language also supports the TO operator, which lets you specify a range of values to search for.
This is quite handy for finding all log messages that include the full spectrum of HTTP response error codes or finding all transactions with a response time above a certain threshold. If you’re interested in finding all log messages from a specific time period, you can use time ranges in your search to efficiently narrow down the results.
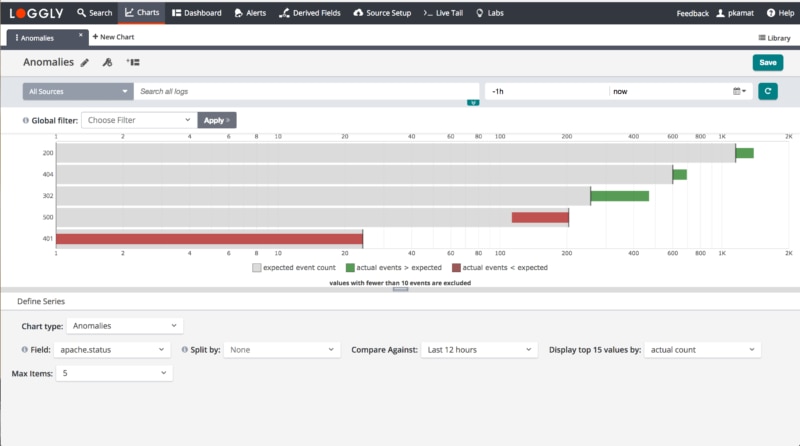
Discovering anomalies can help you identify new, unexpected problems with your app, but it can also confirm that the fix you’ve implemented for a previous issue is now working. The Loggly anomaly detection feature makes it simple to get early indications of major changes in your app’s performance and behavior.
This feature allows you to specify a field name and show if the event frequency has increased or decreased by comparing the expected frequency value with the observed frequency. The anomaly search compares the current time period with a background time range you can control. Once you’ve got log messages for your query, you can sort the output by value significance, value difference, or actual and expected frequency counts to instantaneously see the most important results.
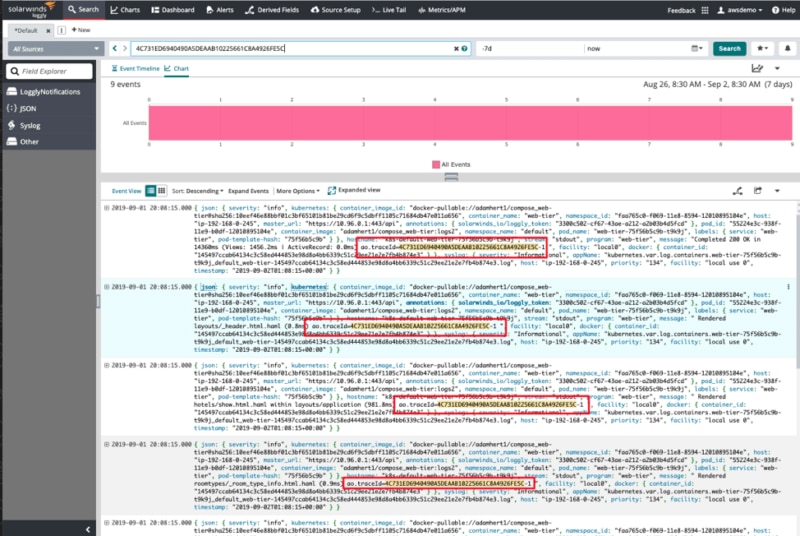
Tracing errors and exceptions across services and correlating them with requests is normally a complex and time-consuming task. While you can use logging session IDs and API tokens to try and establish which log messages belong to which request, Loggly offers a better solution.
Loggly integrates seamlessly with SolarWinds AppOptics™ to provide additional trace context for your logs by automatically inserting a shared trace ID. This ID can be used to effortlessly correlate log messages with requests, so you can filter out the noise in your log data and find the root cause of issues sooner. The integration uses a shared agent design to automatically instrument your app and propagates the trace ID using HTTP headers, which means you don’t need to modify your code to benefit from the additional trace context.
Looking to expand your options? Try the SolarWinds Apache Log Analysis