Technical Resources
Educational Resources
APM Integrated Experience
Connect with Us
Most log file analyzers require organizations to set up their own servers and custom environment. Configuring, managing, and maintaining this setup is a resource-intensive and complex exercise.
A lot of teams depend on open-source, free web log analyzers for their log management. Many of these log analyzer tools can get very slow when searching massive log volumes.
Some tools offer a powerful CLI but can lack the ability to produce detailed charts and reports using smart analytics. Unwanted alerts arising from traditional event log analyzers can lead to alert fatigue.
SolarWinds® Loggly® makes log management and analysis simple with a simple setup and configuration that helps you get started quickly. It has an agentless architecture that makes deployment faster.
Furthermore, Loggly log analyzer offers both the server and application-level logging, which means you can have a single interface to capture and monitor all your logs at a lower operational cost. By creating a single source of truth for your distributed team, you can ensure that issues are resolved quickly. To upload logs to Loggly, you can use either syslog or any other log source (e.g., Fluentd, Docker, rsyslog, etc.) of your choice.
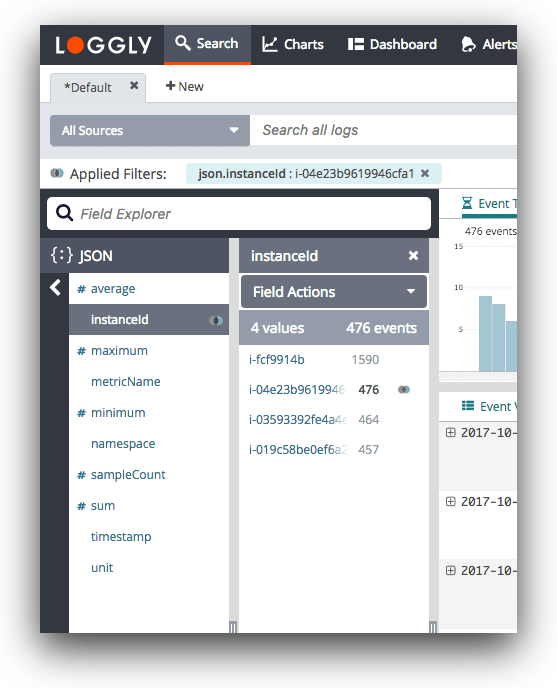
Loggly is a cloud-based log analyzer and log management solution that provides real-time answers to your operational questions without requiring you to log into individual servers or learn complex commands. Loggly’s Dynamic Field Explorer offers a convenient click-and-browse experience with a structured summary of all your log data. This ensures you don’t have to start your searches from a blinking cursor on a blank console.
Loggly is highly efficient in searching through current as well as past data, which helps in faster troubleshooting across the entire distributed stack. Furthermore, Loggly links exception logs to the source code with GitHub integration. This makes it possible for your team to find the exact line of trouble-causing code with a single click.
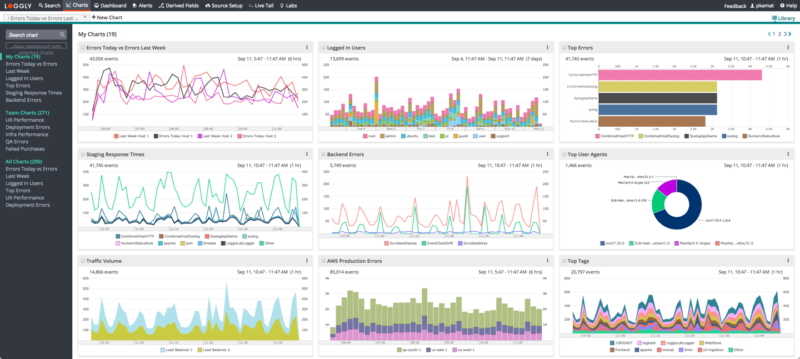
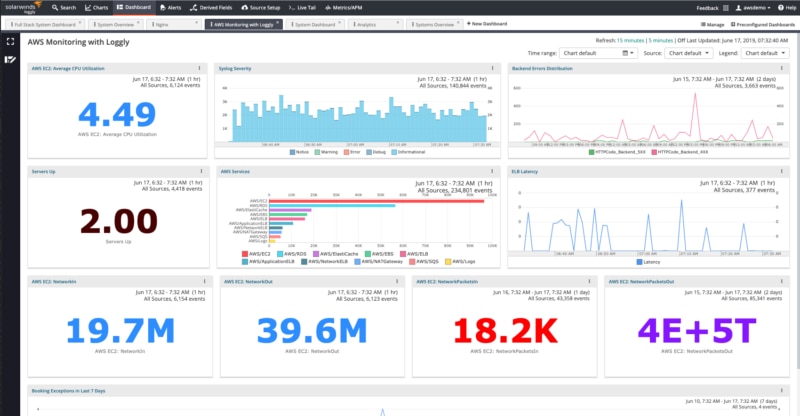
Loggly helps you make sure that everyone can monitor logs in a highly visual manner using advanced charts and interactive dashboards. The dashboards help you monitor important metrics and other indicators and can be displayed on large screens for everyone to be on the same page. Loggly automatically analyzes log data over a period and keeps track of trends in different time frames, which allows your team to detect anomalies without fail.
Moreover, you can click a spike in the dashboard to find associated logs for further troubleshooting and analysis. Unlike traditional count-based thresholds, you can also specify a threshold in relative terms using standard deviations in Loggly. This feature makes it easy to set up the right kind of alerts and reduce false alarms significantly.
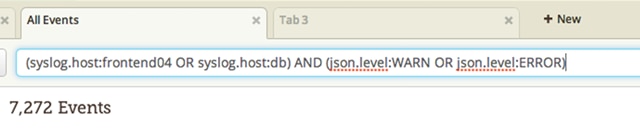
Because Loggly stores your log files in the cloud, accessing them is both fast and efficient. But sometimes you need to cut through huge volumes of log data to find the most pertinent parts. Loggly supports a query language based on the popular Apache Lucene syntax.
Use simple search terms for full-text searching to locate the log messages you need or create more complex queries using boolean operators to combine and modify simpler terms. You can even search for ranges of numeric values and words using the TO operator. Using a word range allows you to select messages from multiple logging levels or severities, which is ideal if you’re unsure of the severity of the log message you need to see.
Thanks to the support for multiple log formats, you can search through your logs for values contained in specific fields. Loggly has support for automatically parsing Apache HTTP, JSON, syslog-formatted logs, and many more popular formats, and we’re constantly working to integrate more.
Using field names, you can search for Apache status codes, Apache referrer strings, syslog hostnames fields, and a range of other fields. And if you can’t get the power you need to trim your log data down to size from all of these features, you can use regular expressions, time ranges, or create even more advanced queries by using the Apache Lucene-inspired proximity and fuzzy match features.
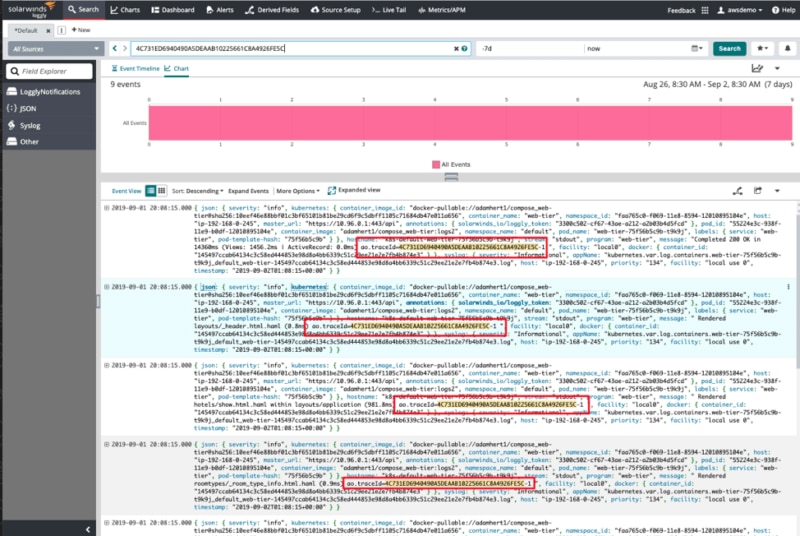
With the integration of SolarWinds AppOptics™ and Loggly, you can combine application performance monitoring (APM) with log analyzer data to discover which requests to your application are causing performance issues. AppOptics automatically inserts a trace ID into your logs, providing you with a unique identifier so you can easily connect together multiple log messages and understand the events involved in a single request.
You don’t even need to modify any of your code or application—the instrumentation happens automatically using HTTP headers to propagate context across software services. Which means instead of increased development costs, you can focus on diagnosing issues and finding the root cause wherever it originated from. It doesn’t matter if your application is written in node.js, PHP, or another language, you can add trace context to your logs.
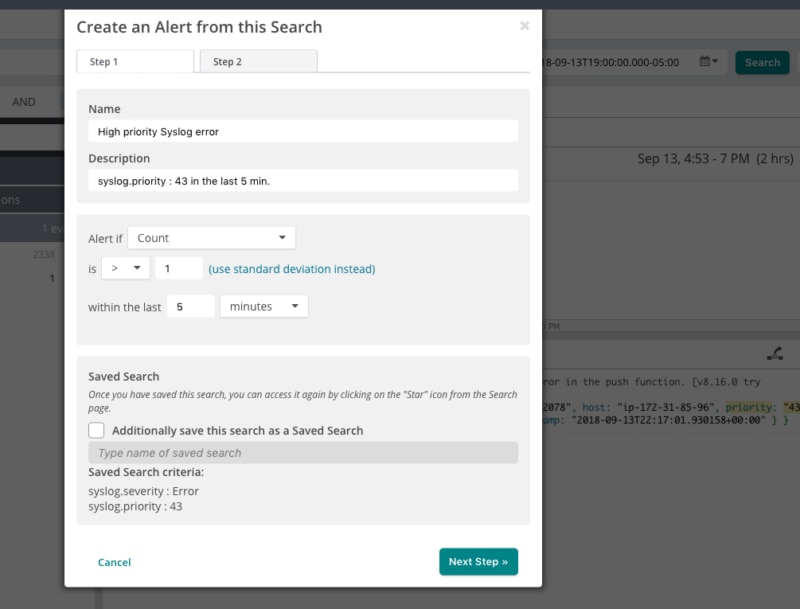
Manually running searches to uncover emerging trends and patterns in your log data can distract you from more important work. Turn your saved searches into automatic alerts and schedule them to run with a specified frequency. You can configure thresholds for alerts so that they only trigger when a number of events occur, which is handy for monitoring request latency and error rates.
Loggly supports a range of notification endpoints and you can deliver notifications over email, Slack, PagerDuty, and more. If you’re running your own monitoring software, you can even have Loggly deliver notifications to HTTP webooks using GET and POST requests. Include the 10 most recent events with your notifications to provide your team with the context they need to take action.
Need more options? Don’t miss the SolarWinds Log Visualization