Technical Resources
Educational Resources
APM Integrated Experience
Connect with Us
While Docker logging can be a complex exercise and multiple approaches have their benefits and drawbacks, centralizing all logs in one place has an obvious advantage. SolarWinds Loggly allows you to aggregate your logs, so you can easily parse, analyze, and correlate data across your distributed stack and not just your containers.
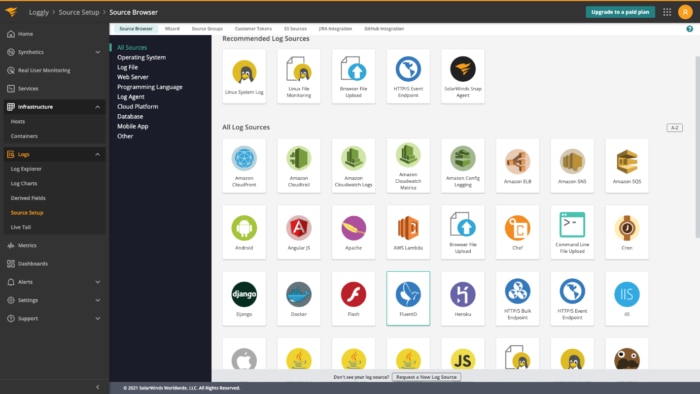
This approach can help you achieve shorter MTTR (mean time to recovery) and improved application uptime and performance. As a cloud-based service with agentless architecture, Loggly makes it simple to collect log lines from different log sources. Though there are multiple ways of sending Docker logs to Loggly, Loggly recommends using Docker Logging Driver.

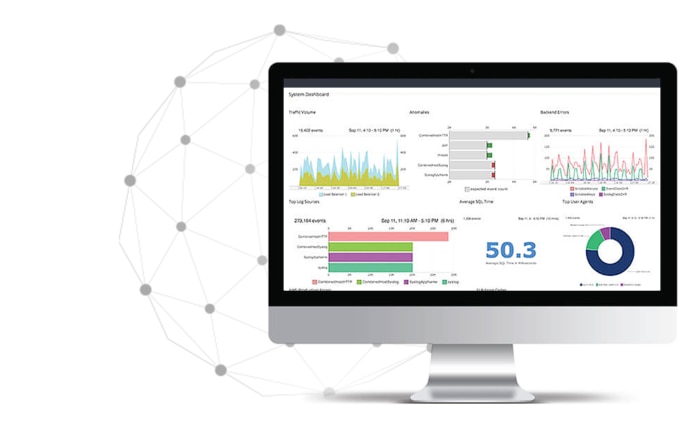
Traditional tools can fail to provide quick search results when searching through a large volume of logs. However, Loggly offers powerful search capabilities to help you get near-instant results. It allows you to inspect the events surrounding a critical event with a single click.
Loggly also automatically parses incoming logs for supported data formats. It allows you to focus on specific logs of interest and filter out noise with its Dynamic Field Explorer™ feature. This explorer provides a structured summary with a guided search experience. It helps boost your troubleshooting, as you don’t have to start your search with a blank console.
Loggly offers integrated charts and dashboards, so you don’t have to configure complex third-party tools for visual analysis. With multiple charts, you can visualize your search results and quickly spot deviations from the norm.
The charts are extremely useful in anomaly detection, as threshold-based alerts can sometimes miss detecting troublesome patterns. You can also share your dashboard with your team members for easy collaboration. Further, Loggly integrates with common notification services (Slack, Microsoft Teams, etc.) and tools like Jira and GitHub, which can help improve your operational efficiency.
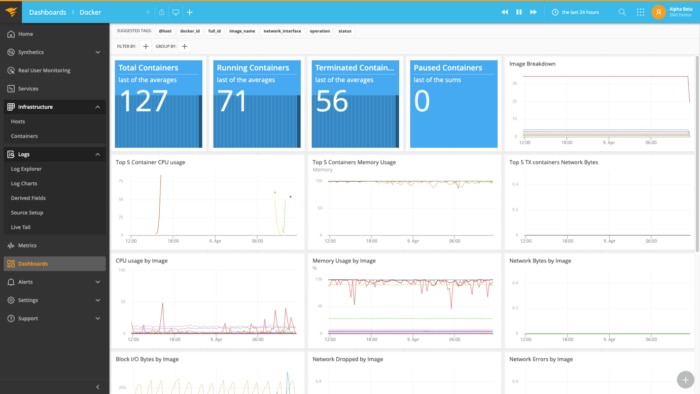
Connect infrastructure health with application performance with AppOptics. The tool offers container, server, and application metrics to determine the root cause of issues. AppOptics provides high-level visualizations of host and container resources, application service-level, and transaction-level summaries, with powerful drill downs to take you down to the poor performing line(s) of code.
The automatic setup in AppOptics collects metrics directly from the Docker daemon, including information about CPU utilization, memory limitations, errors, utilization data, and more. It also performs live code profiling and exception tracking to inspect queries, bugs, and inefficient code quickly.
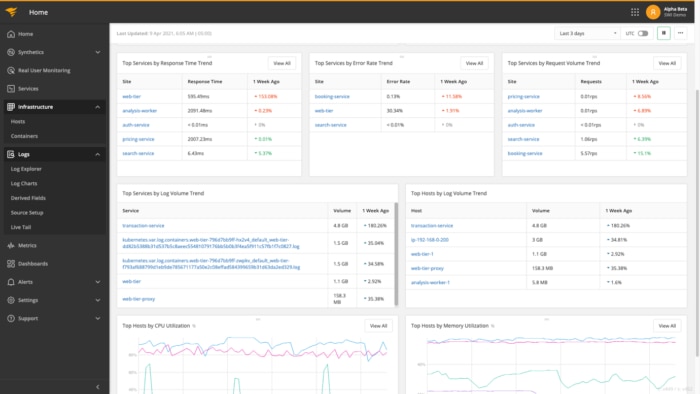
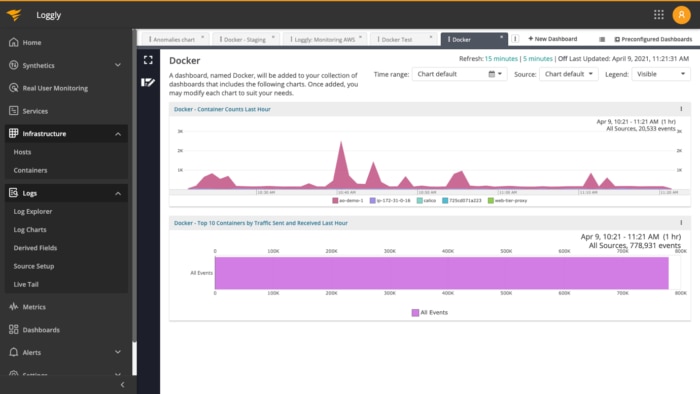
Handling multiple containers, services, and host OS is daunting and can require dependency on multiple tools for log aggregation and management of infrastructure logs. The SolarWinds APM Integrated Experience provides one integrated platform to streamline Docker metrics and log management. Filter necessary logs with the Dynamic Field Explorer and get a structured summary with a guided search experience to resolve infrastructure and application issues. Gain detailed insights into Docker metrics for each container or groups of containers.
Together, these tools provide anomaly detection, multiple charts and graphs, and dashboards to spot troublesome patterns. The APM Integrated Experience offers full-stack Docker monitoring capabilities to improve operational efficiency and end-user experience.
Need something more advanced? Check out the SolarWinds SAM Docker Monitoring.