Technical Resources
Educational Resources
APM Integrated Experience
Connect with Us
Traditional Java log analysis tools are not well-equipped to effectively manage fragmented logs from multiple servers, applications, and frameworks in a large distributed environment.
Most Java log analysis tools lack smart automation and advanced log monitoring features. Such tools become sluggish while dealing with massive log volumes and decelerate Java crash log analysis and troubleshooting.
Teams usually opt for open-source tools to visualize logs for better and faster Java application log analysis. Configuring these tools is complex and can hamper productivity.
Unifying log data is a prerequisite for quick and effective Java log analysis, and SolarWinds® Loggly® helps you solve this challenge. Loggly, a cloud-based log management and analytics solution, aggregates logs in a centralized repository to give you a unified view of all Java logs across your distributed stack.
Compared to other Java log analysis tools, Loggly is easy to set up, simple to use, and supports agentless architecture. You can send your Java logs directly from your application to Loggly via the Loggly Logback extension using the HTTP/S Event API. Consolidated logs from various Java-based projects help in a comprehensive analysis.
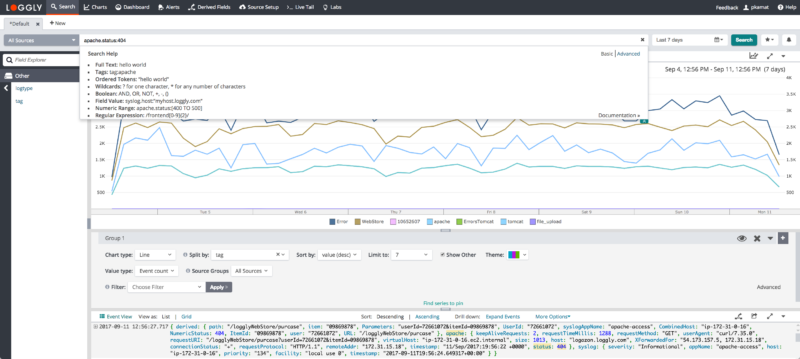
Loggly offers automated parsing to simplify search and analysis of Java logs from multiple applications and frameworks. With the Loggly interactive search feature, you can sift through your log data faster. You don’t have to spend too much time in trial-and-error searches, as the Loggly dynamic field explorer guides you in detailed root-cause analysis and helps you derive quick actionable insights for faster troubleshooting.
The Loggly surround search feature allows you to easily analyze all the related logs that occur before or after any crucial event.
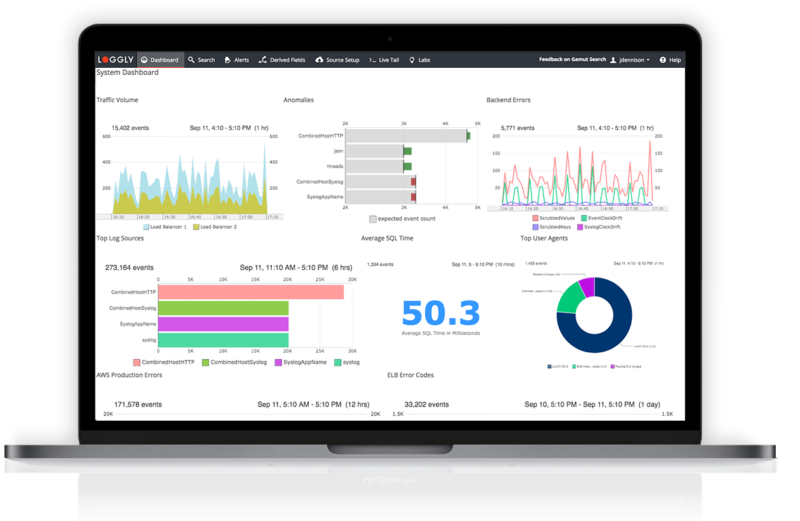
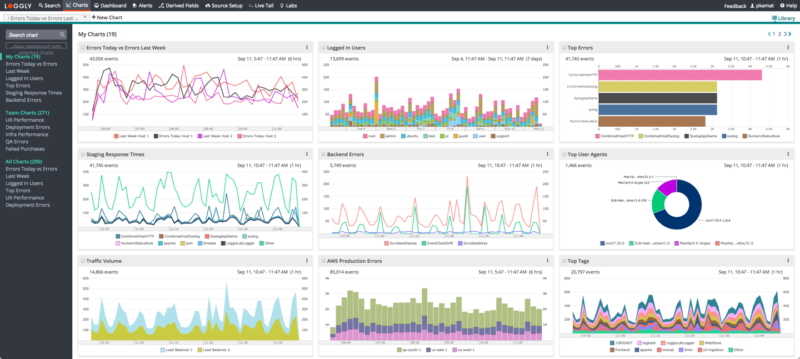
Unlike other Java application log analysis tools, Loggly is built with integrated charts and dashboards to help you in seamless Java log analysis. You can easily monitor key performance indicators and critical metrics to keep track of your Java applications in real time.
You can select different types of charts to visualize your Java log data and spot anomalies and recurring patterns to detect potential issues before they convert into major problems. The Loggly timeshift feature allows you to compare data over a period with a single click. You can use the Loggly interactive dashboards to get a bird’s-eye view of your distributed stack, and can also collaborate with your team by sharing unified dashboards to ensure everyone is on the same page.
Didn’t find what you were after? Consider the SolarWinds Log Visualization