
Technical Resources
Educational Resources
APM Integrated Experience
Connect with Us
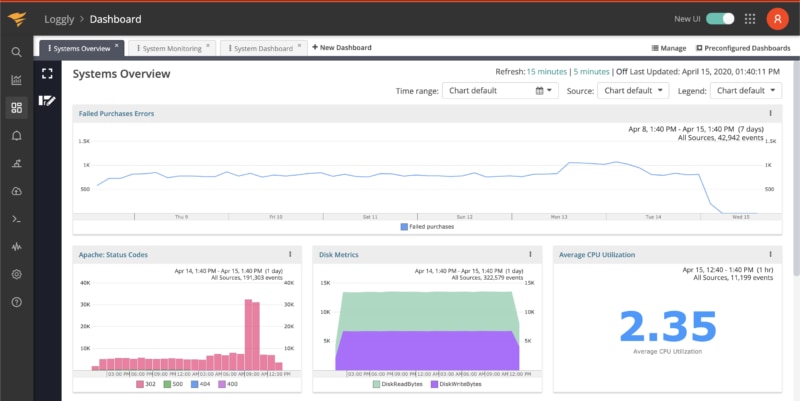
Connect the dots across your web applications, infrastructure, and devices with a unified view across log data. Ready-to-use dashboards provide performance indicators (KPIs) and statistics. Incorporate charts with data from many sources into your log analysis.
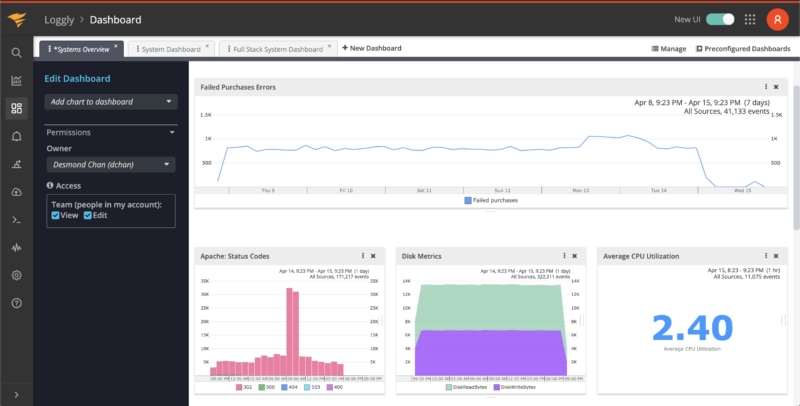
Share one or more dashboards with your team to get their analysis. Control who can view and edit specific dashboards. Copy and modify charts created by peers without having to create new queries.
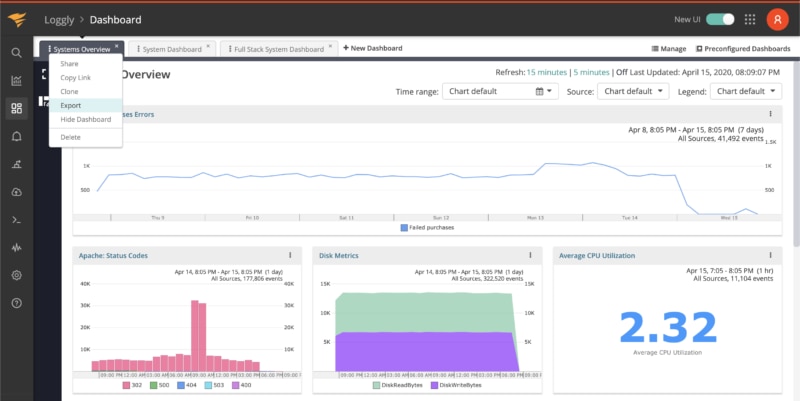
Turn any log dashboard into a shareable report in PNG format. Email reports to your stakeholders or share them via collaboration systems like Slack for further analysis.
Because you can instantly set all charts on a dashboard to reflect the same time range, you can easily analyze your logs.

Loggly is very fast. I wouldn’t be so addicted to Loggly if it wasn’t so fast.
Pedro Gomes Director of Apps Club Business Unit, Bemobi
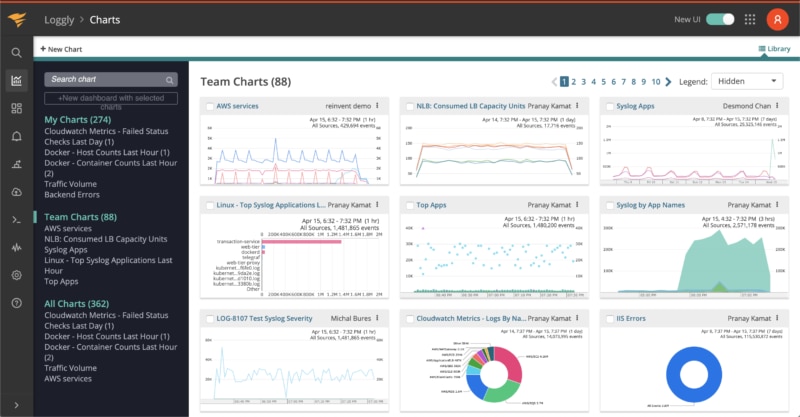
Define reusable charts to simplify dashboard creation. Capture log event counts, averages, percentiles, and more. Create individualized filters for your data series. Use structured, unstructured, and semi-structured log data to create charts, with sorting on both values and labels. Use “pinning” for continuous display of important KPIs. Control who can view and edit your charts.
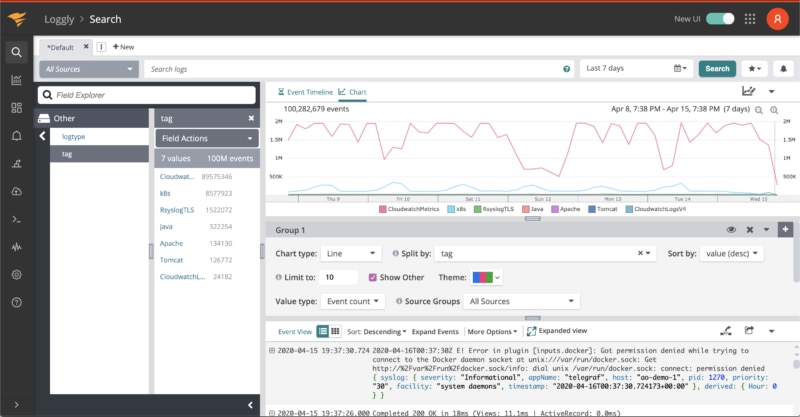
Automatically generate a real-time, bird’s eye view of your logs organized by their inherent structure or by customized views.
You can easily navigate this view like a menu, see log categories, fields, and values, and dig into the details from any point in your logs.
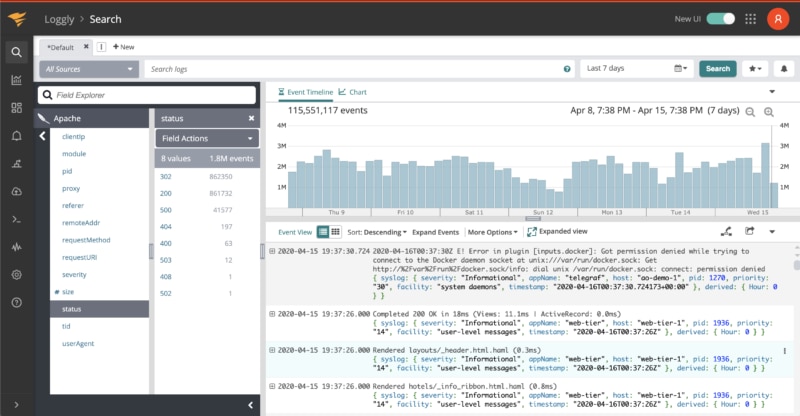
Don’t wait hours for answers. You can search through big data volumes over long time periods with highly interactive, near-instant responses to analyze your logs fast.
LogglyTM doesn’t use a proprietary query language to offer you full-text searches, searches by individual fields, booleans, range searches, regular expressions, and more.
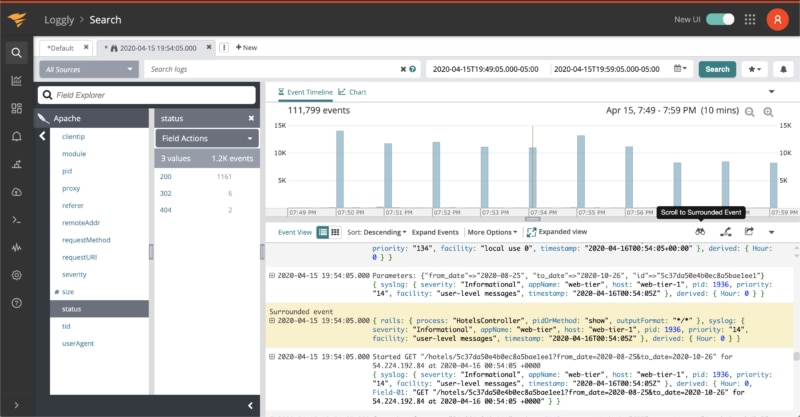
Analyze the events immediately before or after an event of interest with a single click. Understand the context of logs streaming in from your full stack.
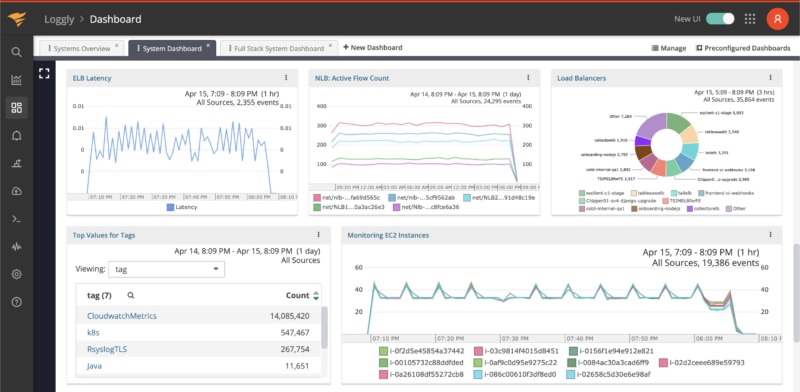
View app performance, system behavior, and unusual activity across the stack. Monitor key resources and metrics, and eliminate issues before they affect users.
Trace issues down to their root cause. See how components interact across your stack, identify correlations, view source code, and share findings with your team.
Work better as a team using data and analysis with DevOps tools. Loggly integrates with Slack, GitHub, Jira, PagerDuty, Microsoft Teams, custom webhooks, and more.
Our multi-tenant SaaS provides a secure, fast, scalable, and highly available solution to meet the highest standards while keeping TCO low.
See how easy it is to visualize your data in Loggly dashboards.