Technical Resources
Educational Resources
APM Integrated Experience
Connect with Us
In distributed environments, IT teams manage and monitor logs from multiple applications. Ensuring logging levels are maintained and logs are stored reliably is complex.
It’s not easy to monitor and analyze logs across multiple sources. Developers lack tools to automatically parse Java logs and make indexing, sorting, searching, and filtering log files easier.
Teams searching for an end-to-end web application Java log viewer often end up configuring multiple open-source tools. Making sure these tools work in tandem can take a lot of time and effort.
SolarWinds® Loggly® can serve as an advanced Java log viewer, enabling centralized log management, intelligent alerts, analytics, visualization, and more. It has an agentless architecture, which means you don’t have to install software for log aggregation. To transmit Java logs to Loggly, you can use the Logback SyslogAppender.
By monitoring all your logs in one place, you can easily correlate events and get to the root cause of issues faster. As a cloud-based service, Loggly simplifies the initial configuration and allows you to get started quickly. And, Loggly can automatically archive your logs to Amazon S3 buckets to help you demonstrate compliance.
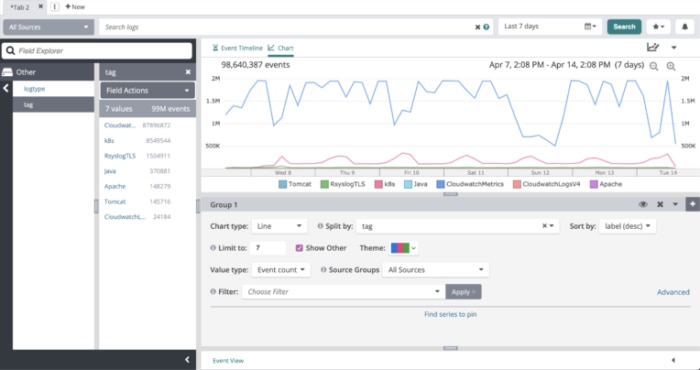
Loggly allows you to search through a large volume of logs and extract useful information using advanced filters and fields. It automatically parses your logs into various fields to help you rapidly home in on specific areas. You can view the parsed logs using the Dynamic Field Explorer™, which provides a guided search experience. The feature allows you to click and browse through the logs and extract useful information without typing complex queries.
Further, with features like surround search, you can easily inspect a trail of events in near-real time. With all these and more, Loggly can significantly reduce your time and effort in troubleshooting.
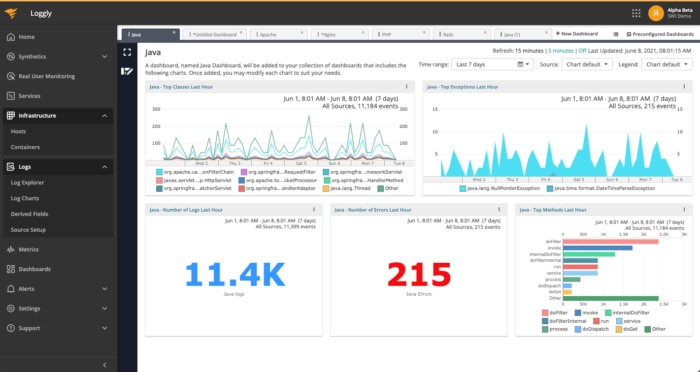
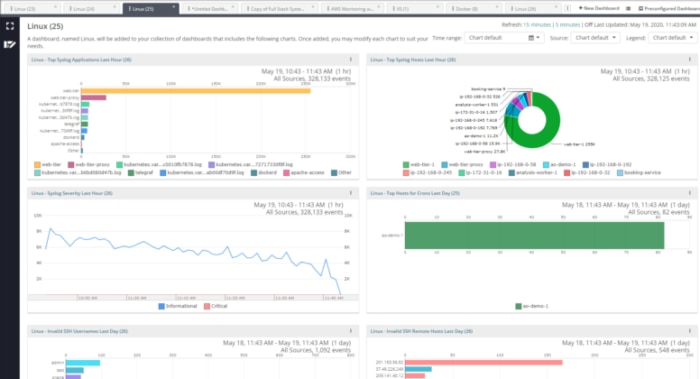
Loggly offers advanced visualization to help you get a quick overview of your applications and environment. You can use a pre-configured dashboard to monitor Java applications. Further, you can also create custom dashboards using a wide range of charts and graphs. The visualizations help you spot deviations from the norm and recognize important trends.
The charts in a dashboard can be synced with a single click and are easily dragged and resized. You may also share the dashboard with your team to give them a bird’s-eye view of the environment. Further, you can download your dashboard in PNG format to include it in reports or emails.
On the hunt for more? Don’t forget to visit the SolarWinds Log Visualization