Technical Resources
Educational Resources
APM Integrated Experience
Connect with Us
SolarWinds® Loggly® doesn’t require you to install proprietary agents to collect your logs, eliminating unnecessary dependencies and making log aggregation more straightforward for you. You can use an automated script or configure using rsyslog to monitor for log files and send them to Loggly.
Loggly automatically parses structured or semi-structured MongoDB log data, making log messages more meaningful and actionable. You can also customize and manage the built-in parsing rules to bring consistency to log data from multiple sources.
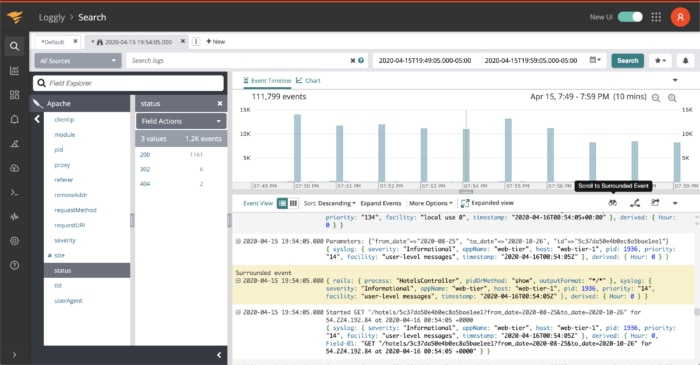
Loggly is a multi-tenant SaaS solution and scales to store massive datasets reliably and efficiently as your log volume grows. The Loggly search query language is based on Apache Lucene and offers powerful options to quickly get to the root of a problem. You can search log data based on Boolean values, regular expressions, data fields, or full-text queries. It provides near-instant query results even when querying big datasets, allowing you to find valuable information to troubleshoot problems quickly.
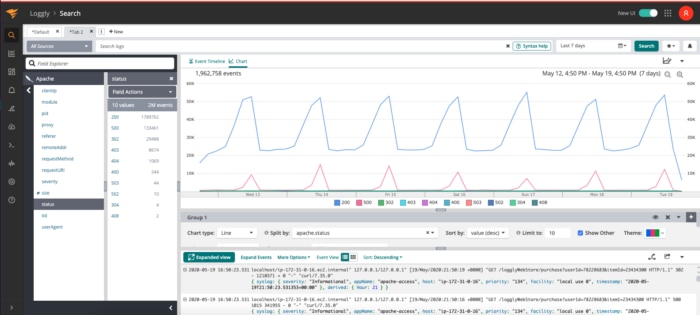
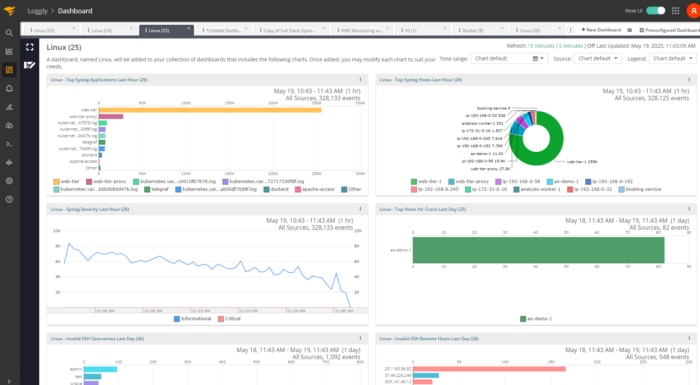
Loggly provides built-in dashboards to visualize and monitor log data and track various metrics and performance indicators. You can customize or build dashboards to monitor MongoDB health, query latency, and transactions. You can create charts based on log data search queries on time-series and non-time-series data, such as area, bar, and line charts. Additionally, you can compare specific metrics against past data to analyze performance trends and identify bottlenecks. For collaboration, you can share dashboards with other team members or groups via Slack or email.
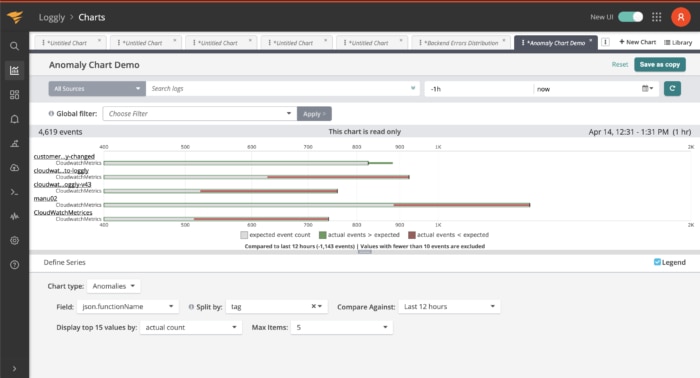
Loggly analyzes log data continuously to learn and recognize standard patterns in log messages and events. With this baseline, Loggly can spot unusual activity patterns, enabling you to catch abnormal messages or suspicious activity and address issues before they lead to problems.
You can set up alerts based on your search queries, such as searches for the number of log messages per second, error codes, or average response latency. Loggly automatically runs the queries at set intervals and sends alerts when a metric or behavior breaks the threshold.
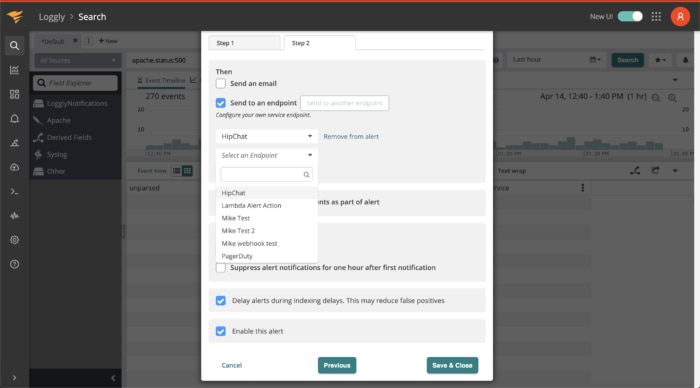
Loggly integrates with a wide range of tools and solutions used in your DevOps pipeline, including Slack, GitHub, Jira, and PagerDuty. This enables better collaboration with log data among DevOps teams. For example, Loggly integrates with your default notification service using webhooks to deliver alerts. It integrates with GitHub to link log data to source code, enabling you to connect performance improvements or errors to changes in code releases. Moreover, you can directly log Jira tickets from Loggly with pre-populated fields.
Exploring further? You should check out the SolarWinds Log Analyzer