Technical Resources
Educational Resources
APM Integrated Experience
Connect with Us
Server monitoring and application performance monitoring (APM) are essential to IT service delivery. You can closely integrate them to enhance visibility into overall system health and troubleshoot problems early on.
AppOptics offers infrastructure and application monitoring and provides more than 150 out-of-the-box integrations to monitor on-premises, cloud, and hybrid IT environments, including dozens of out-of-the-box AWS and Azure integrations. AppOptics APM uses auto-instrumentation to simplify application monitoring with distributed tracing, live-code profiling, and exception tracking, accelerating root cause analysis.
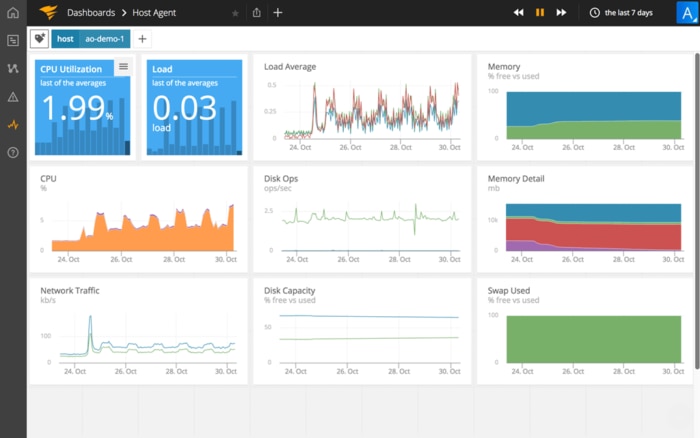
AppOptics monitors host machines, virtual servers, and containers across your IT environment and provides color-coded heat maps to identify infrastructure problems quickly. It reports system utilization and time-series metrics on system performance. You can also customize dashboards and set alerts based on metrics such as CPU utilization or disk space.

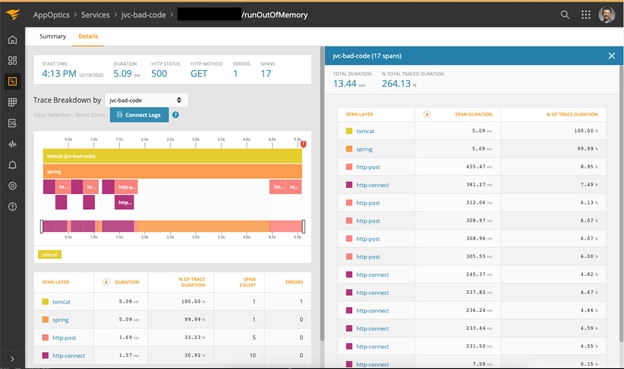
AppOptics offers auto-instrumentation capabilities to simplify application monitoring deployment and distributed tracing. It supports a broad range of languages, frameworks, and libraries, including Java, .Net, Go, Ruby, Scala, Node.js, Python, and PHP. It tracks application requests using distributed tracing to track how various application components served requests. AppOptics can also perform live-code profiling to pinpoint performance issues to the line of code, library, or framework. You can deploy AppOptics APM in development and testing environments to troubleshoot performance issues.
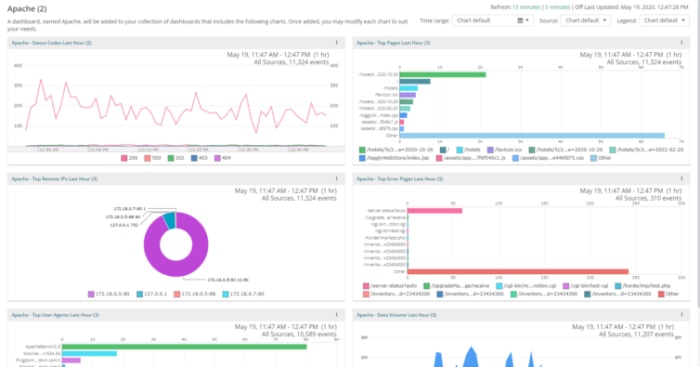
While AppOptics offers infrastructure and application monitoring, Loggly allows you to efficiently aggregate, store, analyze, and manage log data from various sources. Loggly doesn’t require installing agents, scales to handle terabytes of data, and provides near-instant query results even on relatively bigger datasets.
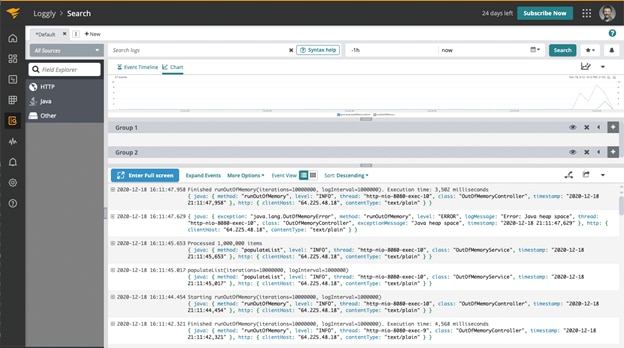
The tight integration of Loggly and AppOptics enables you to view the log data relevant to a specific trace. With a single click, you can go from an AppOptics trace into all the log events created from the services that supported the specific transaction trace. This helps you understand performance issues with more granular data and remediate problems with better root cause analysis. AppOptics one-click visibility into log data also applies to any host shown in the AppOptics dashboard, giving you faster access to relevant log data.
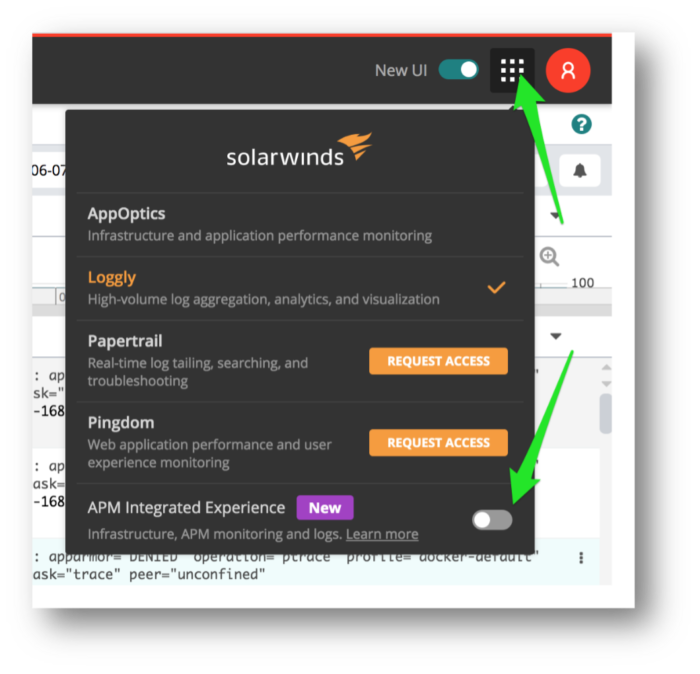
Together, AppOptics and Loggly enhance visibility into your IT environment and pinpoint root causes of performance issues to help you contain service disruptions. AppOptics, Loggly, and Pingdom® web performance monitor are all part of the SolarWinds APM integrated experience—one platform for monitoring and troubleshooting user experience, applications, and their supporting infrastructure.
Exploring further? You should check out the SolarWinds Server Monitoring Software