Technical Resources
Educational Resources
APM Integrated Experience
Connect with Us
In large organizations, IT teams are burdened with the task of managing and monitoring logs from different servers, applications, and endpoints. It’s not easy to manage logs across multiple disparate sources.
Today organizations operate in a complex hybrid environment with applications on cloud-based microservices architectures. Monitoring logs in such environments can be a big challenge.
Teams often lack tools with integrated search, analysis, and visualization capabilities. Instead, they configure and shuffle between multiple tools, which can be a hassle.
SolarWinds® Loggly® allows you to stream your text-based logs to the cloud for reliable and efficient management and analytics. You can also perform web log analysis with Loggly using the application packs for Apache and Nginx. These packs help you set up pre-configured monitoring dashboards. As Loggly has an agentless architecture, you don’t have to install software to stream your logs to the cloud-based service. You can use the default syslog daemon to send your Apache and Nginx logs to Loggly. Loggly provides capabilities to solve virtually all logging issues, and it automates most of the initial configuration to help you get started quickly.
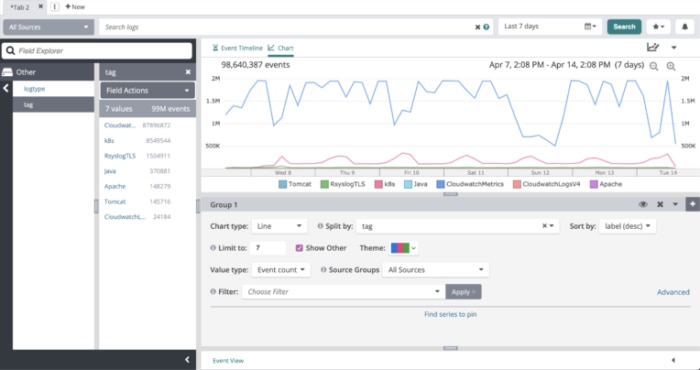
With Loggly, you can rapidly search across a large volume of logs and get near-instant results for your queries. Loggly automatically parses a wide range of logs into various fields. If your logs aren’t among the supported formats for automated parsing, you can define custom parsing rules using the Loggly derived fields feature. As your incoming logs are parsed, they’re updated in the Dynamic Field Explorer™, which helps you extract a quick summary of your logs without typing multiple complex queries. You can also use the surround search feature to inspect a trail of events before or after a critical event.
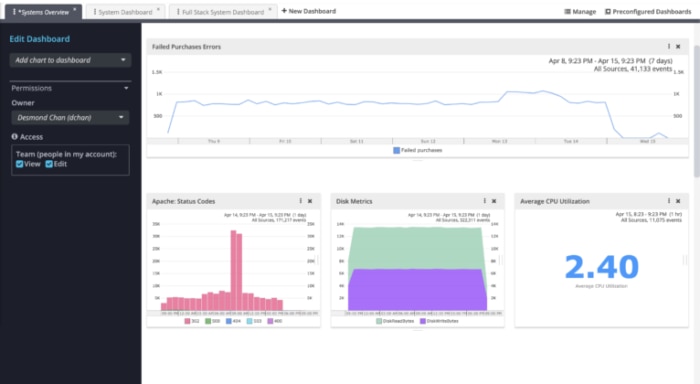
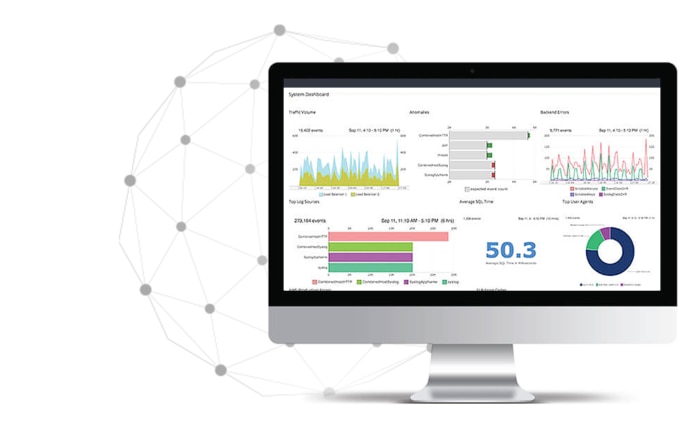
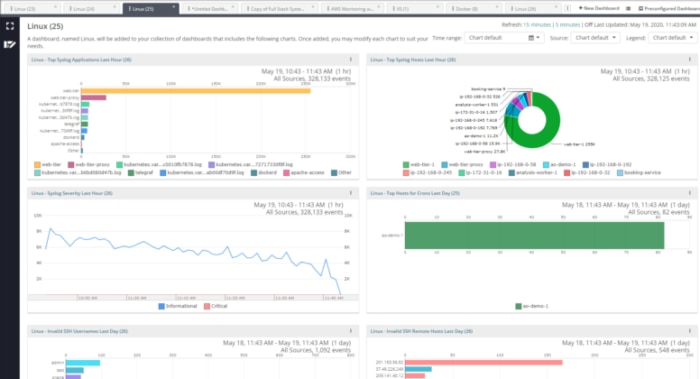
Loggly provides integrated charts and graphs to help you visualize your logs. You can use the pre-configured dashboards to monitor Apache and Nginx server usage and performance. The dashboards can help you spot any spikes in 4xx and 5xx status codes, understand traffic patterns, and identify unusual activity. You can also perform deep user analysis using the access logs. Further, Loggly integrates with tools such as Slack, PagerDuty, Jira, Microsoft Teams, and GitHub to support collaboration and assist in troubleshooting. With all these features and integrations, you can keep your team on the same page and get to the root cause of issues faster.
Want something different? Try the SolarWinds SEM Event Log Analyzer feature.