Technical Resources
Educational Resources
APM Integrated Experience
Connect with Us
If you have multiple applications running across distributed servers, keeping track of countless distinct log files with millions of log lines entries is not easy.
Monitoring infinite log data from several distinct sources for diagnosing and debugging issues can become a complex task for developers. Diagnosing the root cause of a problem manually takes valuable time away from developers.
Analyzing multiple log entries to keep track of application performance, system behavior, or any unusual activity across the distributed stack needs ample time and smart tools for data interpretation.
An application logging tool like SolarWinds® Loggly® helps aggregate and display all the application logs in a centralized system for consistent application management and monitoring. You can send data to Loggly through syslog for the system and file-based logs, or use Loggly’s HTTP API for custom applications.
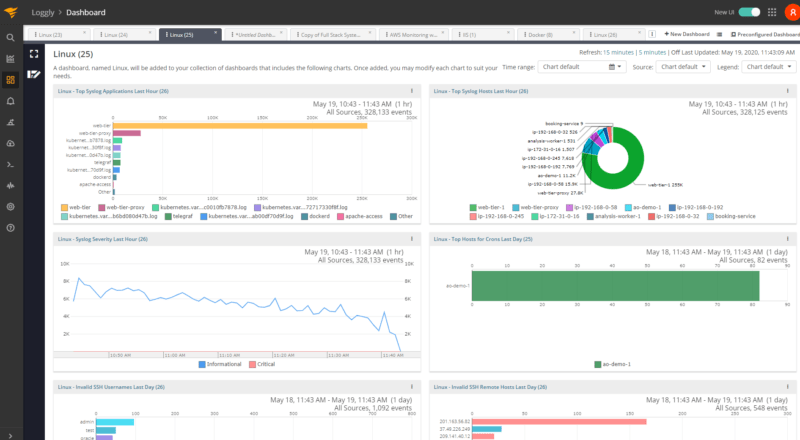
With centralized application logging capability, you easily get a unified view of different servers and application environments. For instance, if you have various web applications on distinct platforms like Apache, IIS, and NGINX and you want to see Apache events logged only on a specific web server, instead of manually reading text files one by one, you could use Loggly and refer to Apache-specific dashboards.
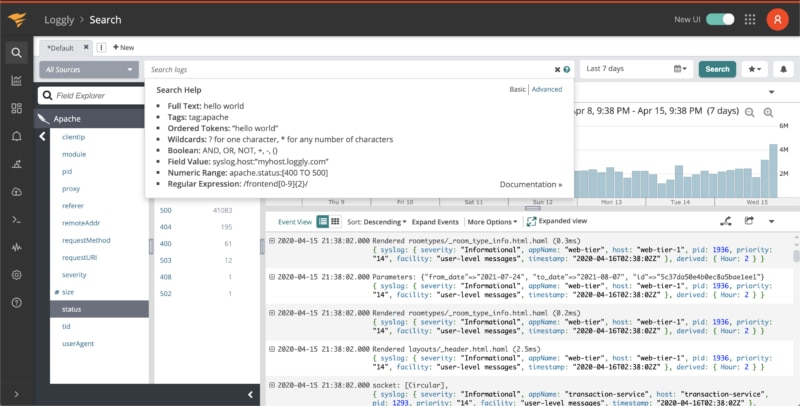
Loggly helps narrow down searches with seamless filtering and sorting of log data to expedite troubleshooting.
Having knowledge of any proprietary query language to search the log data is not a pre-requisite while working with Loggly, as it provides an intuitive user interface for easy navigation through the data logs. One of the smart features Loggly offers is dynamic field viewer, which represents a structured summary of parsed application logs. This attribute ensures a guided search experience to discover the root cause for any application issue instantly.
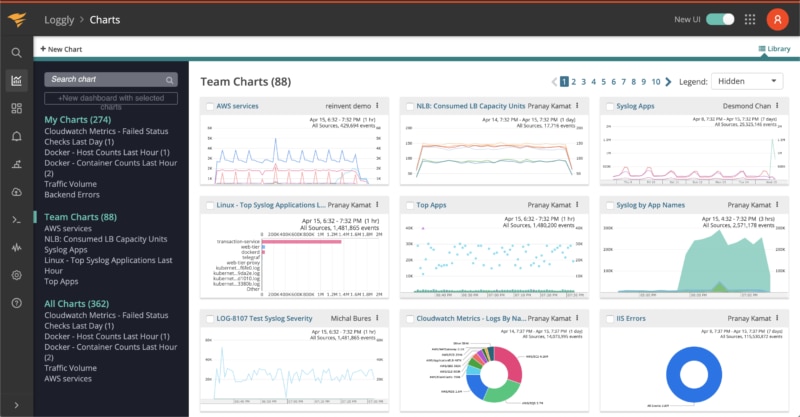
Loggly is a cloud-based solution for log data management that simplifies application logging, and allows easy log monitoring and analysis through interactive charts and dashboards. These dashboards display key performance indicators and metrics related to the performance and usage of various systems and applications.
You can use various chart types for the visual representation of log data. For example, the anomalies chart helps you identify any unusual recurring patterns or other strong trends. You can also analyze the application performance over a specific period by syncing all charts in the dashboard to the same time range, with a single click
Looking to expand your options? Try the SolarWinds SEM