Technical Resources
Educational Resources
APM Integrated Experience
Connect with Us
In distributed systems, there are various types of logs which may or may not be in the JSON logging format. Traditional in-house setups are not equipped to handle this complexity.
Many log analysis solutions tend to get slower as the log volume increases. With limited automation, searching through text logs and tracing the root cause of issues takes a great deal of time and effort.
Teams often rely on multiple open-source solutions to visualize their logs. All these tools, however, require complex configurations. Teams have to constantly shuffle between multiple tools.
SolarWinds® Loggly® is a cloud-based log management and analytics solution which supports a large variety of structured and unstructured text logs. However, as JSON has become a standard log format, you can consider logging in JSON. JSON essentially creates a structured database of your logs, even if there are too many events for you to read manually.
With Loggly, you can crunch through hundreds of thousands of JSON events per second and extract the true value of JSON logging. Because Loggly doesn’t use agents, it is also incredibly easy to set up. Moreover, as your logs move past the log retention period, Loggly automatically archives them on AWS S3 buckets. You can maintain these logs for as long as you want for compliance or other purposes.
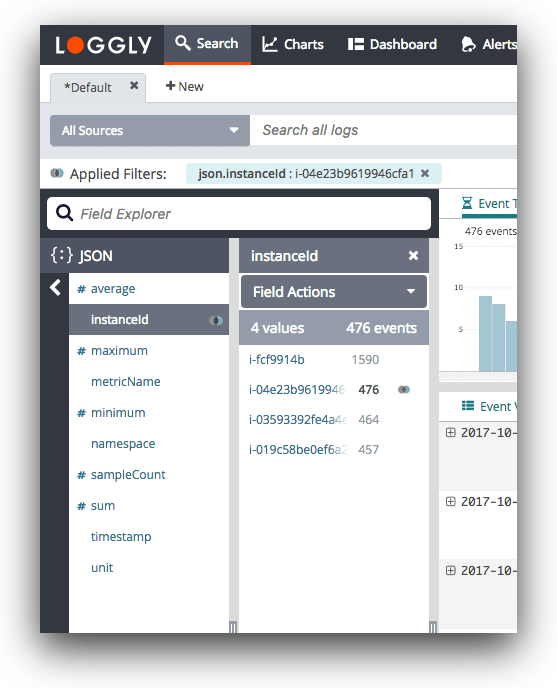
If you are logging in JSON, you’re already on the right path; however, your JSON logging efforts won’t be effective until you put in place a scalable, reliable JSON log viewer that can take full advantage of JSON’s structure. Loggly parses logs as soon as it receives them, creating a real-time map of your logs’ structure that is viewable and clickable through the dynamic field explorer.
Instead of relying on guesswork and iterative searches to figure out where to look for a problem, you can utilize JSON field counts and other metrics to guide you to the answers. With JSON’s flexibility for adding and removing fields, Loggly even picks up changes to your logs with no action on your part. The explorer significantly reduces the time in troubleshooting and helps you quickly gain useful insights into your data.
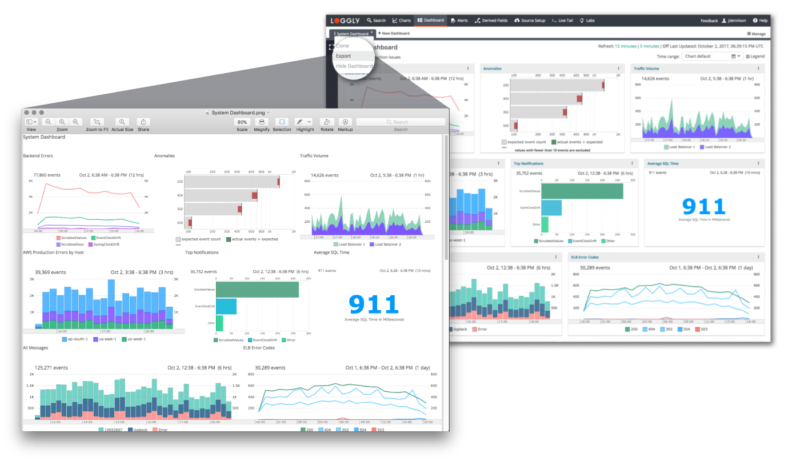
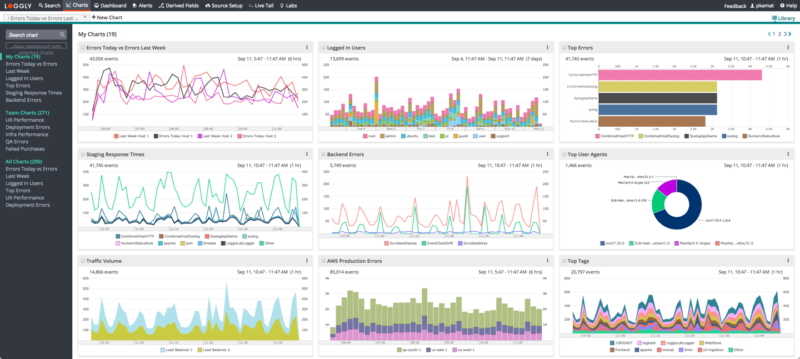
In addition to providing a powerful JSON logger, Loggly offers integrated charts which allow you to visualize the results of your search query. There are many types of bar or line charts to choose from. These charts can be combined together to create a unified dashboard.
You can share these dashboards with your team and restrict access to who can manage and edit the dashboards. Furthermore, the dashboard can be downloaded in the form of a PNG image, in case you want to send a report to anyone via email, HipChat, or Slack. You can also project the dashboard on large screens in your operations center to keep everyone on the same page. Loggly also integrates with DevOps tools like Jira and GitHub to help your team collaborate smoothly.
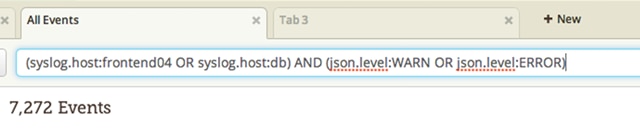
Quickly understanding your JSON data is vital when troubleshooting and debugging issues in production. Loggly offers a simple search query language, based on Apache Lucene, for efficiently trimming down the volume of log data. The query language provides standard boolean operators such as AND, OR, and NOT, and also the TO operator which allows you to specify a range of values to search for.
The TO operator is handy for searching for log messages containing the full range of HTTP response error codes, or for finding all messages that show a transaction latency above a given threshold. If you need to perform more powerful queries, the fuzzy and proximity match features allow you to search for tokens within a certain distance of each other, or a provided character edit distance.
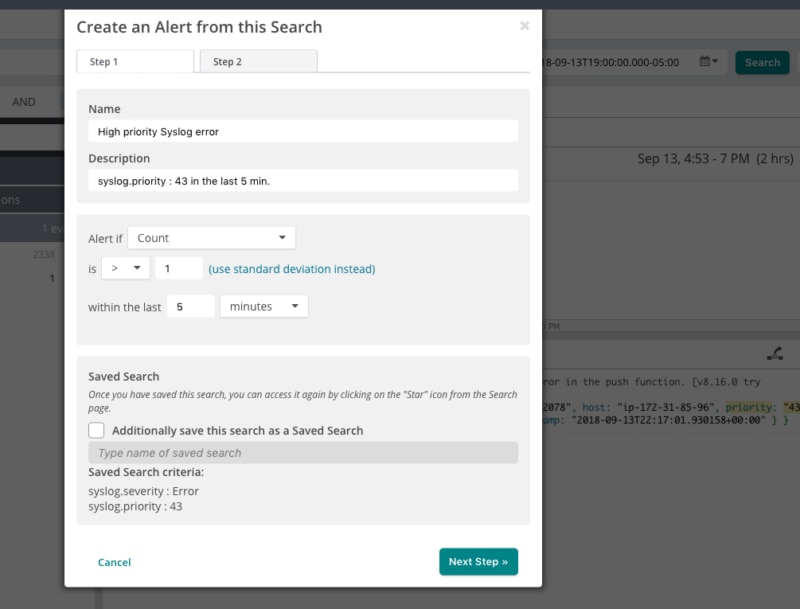
Turn your saved search queries into alerts and receive instant notifications whenever they trigger. With alerts, you can schedule your saved searches to run at a predetermined time and assign individual alert thresholds so that alerts only trigger when a given number of events (or lack of events) is seen. Alert thresholds can be used to implement traffic spike and request latency warnings, or to detect an unexpected rise in the number of HTTP response status error codes.
Once an alert triggers, you can direct its output to a third-party tool using alert endpoints. Loggly supports endpoints for many popular communication tools including Slack, HipChat, and PagerDuty. And of course, you and your team can always receive alerts via email or HTTP endpoints using GET and POST.
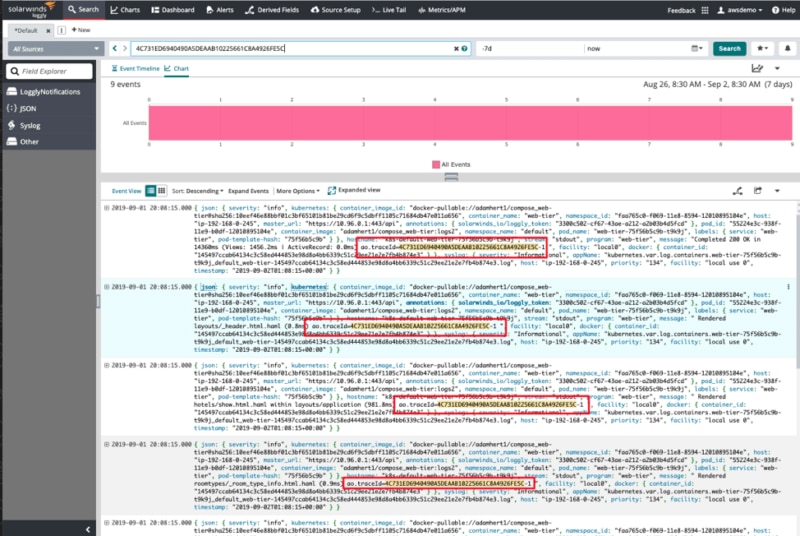
Figuring out which errors and exceptions are associated with a request is incredibly time-consuming for large log files. And because the data is often incomplete, it frequently involves making guesses and assumptions. SolarWinds AppOptics™ and Loggly integrate seamlessly to insert a shared trace ID into your logs. The trace ID allows you to correlate individual log messages with requests and trace errors and exceptions across your services.
The integration uses a shared agent design to automatically instrument your application by propagating the trace ID using HTTP headers and passing the context through to your logs. Which means you don’t need to modify your code or change your infrastructure to reduce analysis and troubleshooting times.
Didn’t find what you were after? Consider the SolarWinds Log Visualization