Technical Resources
Educational Resources
APM Integrated Experience
Connect with Us
In a distributed environment, numerous applications, servers, and endpoints may produce logs in different formats. This lack of standardization makes the management and analysis of logs inefficient.
Traditional logging tools and methods for analyzing logs fail to provide the agility organizations need in solving modern day challenges. Teams often struggle to find the root cause of issues.
It is not easy to monitor logs across a distributed stack. Teams lack tools that can help in visualizing the log data. Also, configuring open-source visualization tools isn’t easy.
JSON offers a structured data format that is lightweight and readable. Most programming languages can parse it. These factors make it ideal for storing and transporting data and that is why it has become a preferred application logging format for teams across the globe. It is advisable to convert your log formats to JSON, which makes log analysis and aggregation easier with tools like SolarWinds® Loggly®.
As a cloud-based JSON log file viewer, Loggly provides unmatched agility and simplicity to carry out logging operations. You can get started within minutes and don’t have to install any agents for sending logs to Loggly.
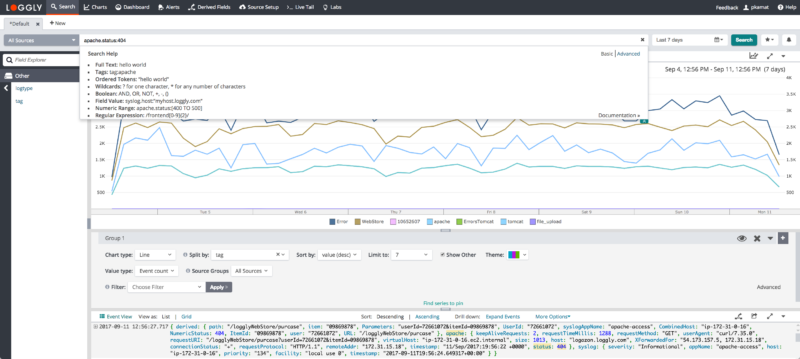
As an advanced JSON log viewer and analyzer, Loggly streamlines troubleshooting and diagnostics with logs. It can automatically parse JSON logs into various fields, allowing you to extract useful information faster. You can browse through the parsed logs using the dynamic field explorer, which reduces noise and helps you explore important fields with minimal effort.
The Loggly surround search feature is another intuitive attribute which allows you to examine all occurrences surrounding a critical event with a single click. With its characteristics, Loggly allows you to search and analyze a large volume of logs easily.
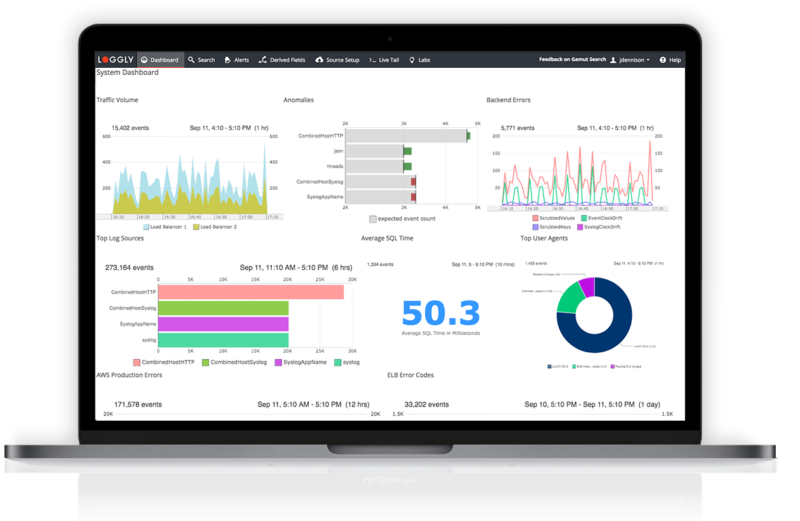
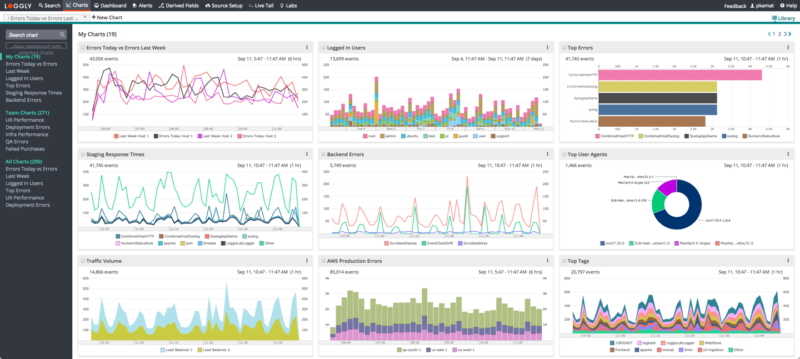
Loggly helps you visualize your search results using various types of charts, which allow you to spot deviations. Using the Loggly charts, you can identify important trends and anomalies easily. By grouping multiple charts, you are able to create a dashboard for monitoring your environment.
Loggly also offers pre-configured dashboards for Java, Python, PHP, Windows, Linux, NGINX, Rails, Docker, Heroku, and many other technologies. They help you get started quickly and monitor key usage and performance statistics. You can share a dashboard with your team and also integrate Loggly with GitHub and Jira to carry out troubleshooting with increased collaboration following your operational processes.
Exploring further? You should check out the SolarWinds Log Visualization