Technical Resources
Educational Resources
APM Integrated Experience
Connect with Us
Developing an end-to-end log management solution that can handle unpredictable log volumes requires a scalable and redundant SaaS logging service. On-premises solutions often lack these capabilities.
Businesses today operate in highly distributed ecosystems that are spread across numerous apps, infrastructure, clouds, and devices. Management of logs from all these sources is not simple.
To develop, configure, and maintain an in-house log management solution, an organization has to allocate critical engineering resources, which can prove to be a significant cost over time.
LaaS is a proven approach to managing and monitoring high-volume log data in modern dynamic environments. The SolarWinds® Loggly® cloud-based log management solution is designed to handle unpredictable spikes in log volume. Loggly gives you the ability to unify all your textual log data and monitor it from a single dashboard.
Moreover, you can rest assured that none of the critical log data is lost even when it has gone past your log retention period. To this end, Loggly gives you the option to archive logs on Amazon S3 buckets, as cloud-based archiving is a convenient way to archive historical logs for compliance and other purposes.
![]Preconfigured-Dashboards (1)-DS](https://www.loggly.com/wp-content/uploads/2018/06/BLOG-1500x700Preconfigured-Dashboards-1-DS-800x395.png)
Whether your organization depends on systems running in your own data center or a hybrid environment, whether these systems have Linux, Windows, Mac, or are serverless—Loggly is designed to support all of it. Loggly helps you collect text log data coming from all possible sources in a quick and efficient manner. It uses open standards for the transfer of log data, which means you don’t have to install any proprietary agents for this purpose.
Furthermore, being a SaaS logging service, Loggly doesn’t involve elaborate setup processes; you can configure the entire logging system with a few clicks.
Loggly is simple to set up and manage, which means you don’t have to lock up critical engineering resources at the expense of your core products or services. This brings a significant reduction in opportunity costs. Furthermore, the service offers easy scalability, flexibility, and higher availability at a much lower TCO when compared with similar in-house systems.
Loggly also helps you stay compliant with security best practices by transmitting data to the cloud over Transport Layer Security (TLS), restricting access with role-based access controls, and much more. This is a crucial requirement for enterprises keen on reducing exposure to online threats, as data breaches can prove to be very costly.
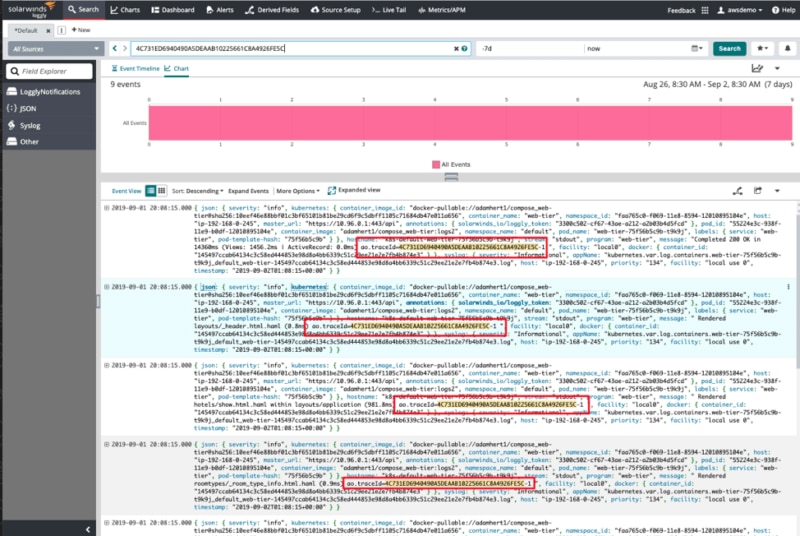
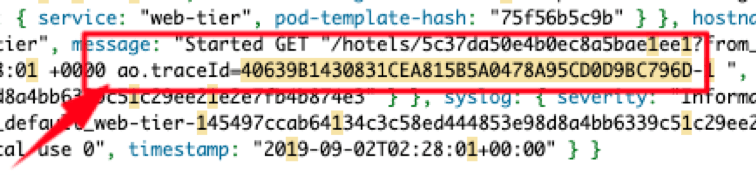
With the integration of SolarWinds AppOptics™ and Loggly, you can effortlessly diagnose and troubleshoot the most complicated problems with minimal effort using a shared trace ID across software services. Trace IDs provide helpful context to messages in your logs, allowing you to easily find related information without relying on manual analysis.
In busy logs that show thousands of messages per minute, trace IDs enable you to accurately correlate log messages with specific requests. And that makes troubleshooting much simpler because you’re able to quickly find the origin of error messages and exceptions, and establish a root cause. Because Loggly is based in the cloud, finding related log messages using a specific trace ID is incredibly fast, even for the applications that produce huge amounts of log files.
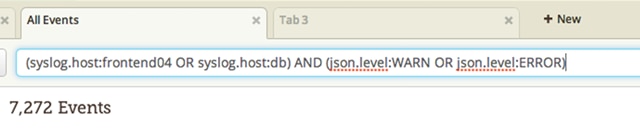
The simple query language from Loggly makes it easy to construct queries to filter out unwanted log messages and focus on the parts you need. The query language is based on Apache Lucene and supports standard boolean operators such as AND, OR, and NOT. With full-text searches, you can narrow down your investigations by searching for error message strings or discover all messages that include any HTTP status code by using the numeric range operator, TO.
Loggly can parse many popular file formats such as Apache HTTP, JSON, and syslog, and we’re constantly adding support for more. If you need maximum control when filtering your logs, regular expressions, time ranges, and Apache lucene-inspired features such as proximity and fuzzy match features give you the power trim your logs down to size and reduce analysis time.
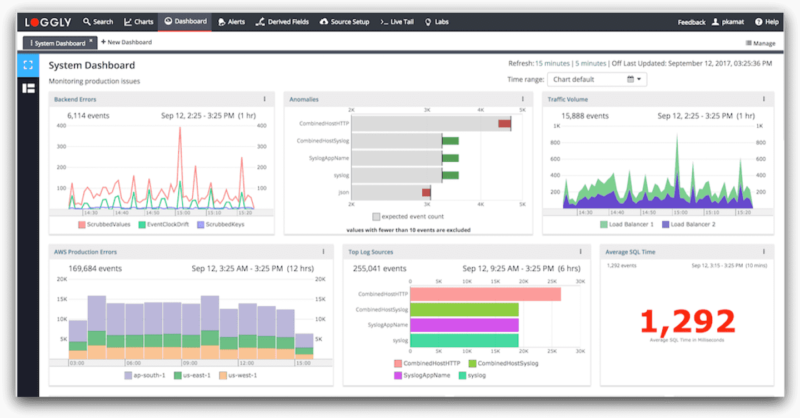
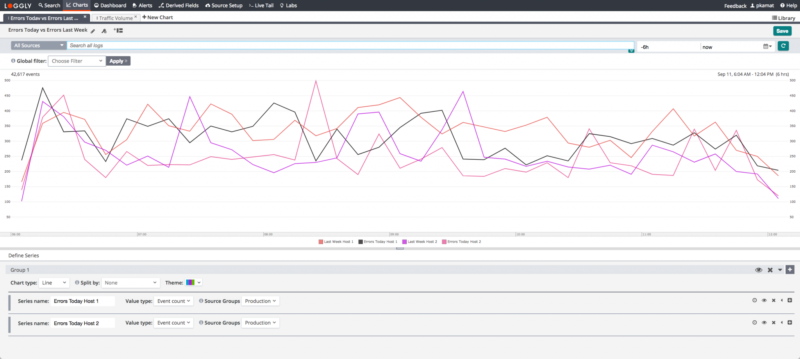
Loggly provides interactive dashboards and reports to efficiently relay the status of your application, help you visually identify trends, and see at a glance how your application is behaving. The interactive dashboard allows you to drill down into finer details by clicking on traffic spikes and pulling up the associated log data, taking you from the big picture to minute detail in a few clicks. Analyze historical data over time to find patterns in your log data and changes in event frequency with Loggly’s anomaly detection feature.
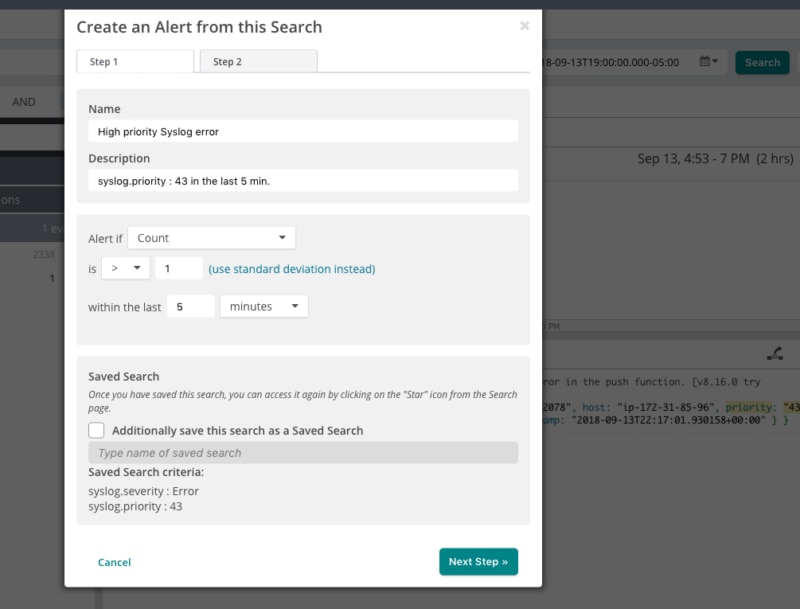
Take the manual work out of discovering problematic metrics and use Loggly’s alerting functionality. With alerts you can pick a schedule to run your saved searches and share the results with your team by automatically sending them over email or other communication tools such as PagerDuty and Slack.
When you need to dive into an issue, you can use the integrated SolarWinds APM tools to track trace IDs across software services and focus on the log messages and exceptions that matter. With trace IDs, you can avoid debugging based on assumptions and precisely trace the flow of anomalous events back to their source, and pinpoint the root cause.
You won’t need to guess whether two log messages are related — you’ll know for sure. Once you’ve found a trace ID of interest you can use the trace view in AppOptics to jump to Loggly and comb through related log messages there.
On the hunt for more? Don’t forget to visit the SolarWinds Enterprise Log Management