Technical Resources
Educational Resources
APM Integrated Experience
Connect with Us
In modern enterprise environments, log volumes can swell up in no time. Teams are often unprepared to handle spikes and lack a reliable, scalable setup for managing their logs.
Traditional NGINX log viewers offer little help in analyzing a large volume of logs. It becomes difficult for teams to tag, filter, parse, and search logs with every step requiring increased attention.
In large setups, it becomes challenging for a team to check NGINX logs continuously. They lack tools that can provide a quick visual overview of their environment to reduce time and effort in troubleshooting.
In a small setup, it might be possible for teams to analyze individual server logs for troubleshooting. However, when organizations scale up, they need to manage and monitor all their logs centrally.
SolarWinds® Loggly® offers a cloud-based service for the purpose; you can aggregate and monitor all your logs using the Loggly interactive search and analysis features. Unlike common log analyzers, Loggly offers an easy setup and can get you started quickly. To send NGINX logs to Loggly, you may use syslog daemons such as rsyslog. With minimal configuration, higher performance, and scale, Loggly is an ideal log management tool for teams seeking higher agility.
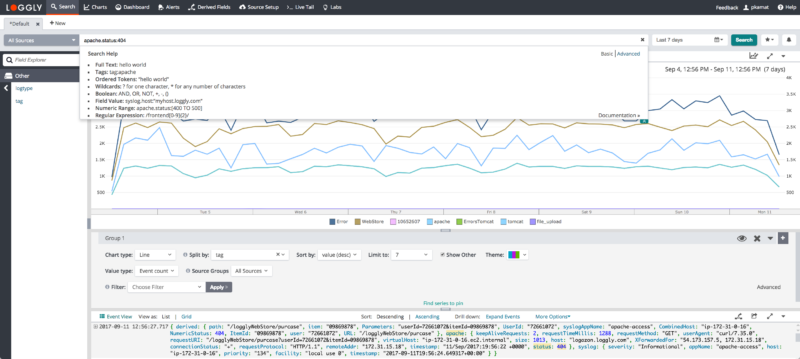
Loggly expedites troubleshooting by offering quicker results to all your search queries. You don’t need to rely on a traditional NGINX log parser, as Loggly automatically parses incoming logs into various fields for advanced statistical analysis and visualization.
It allows you to browse through your parsed logs using the dynamic field explorer. With this explorer, you can extract relevant information from your logs without typing multiple search queries. Loggly also allows you to explore all logs surrounding a critical event with its surround search feature. With these and several other interactive attributes, Loggly significantly improves your troubleshooting speed and experience.
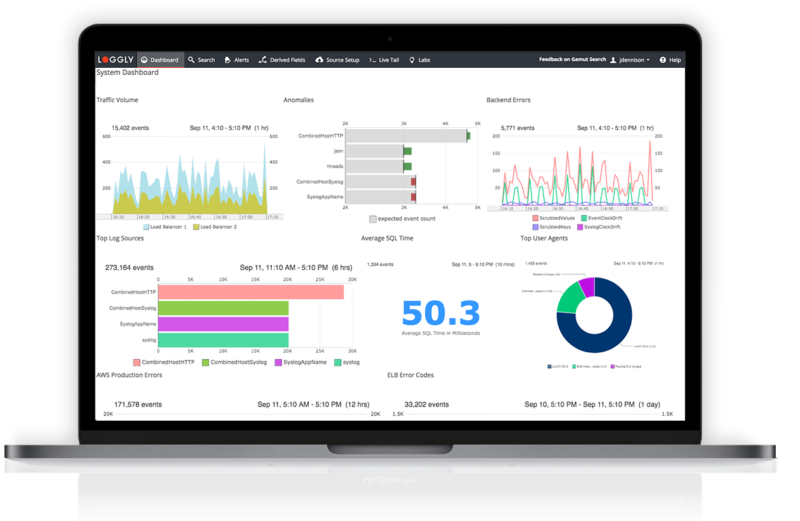
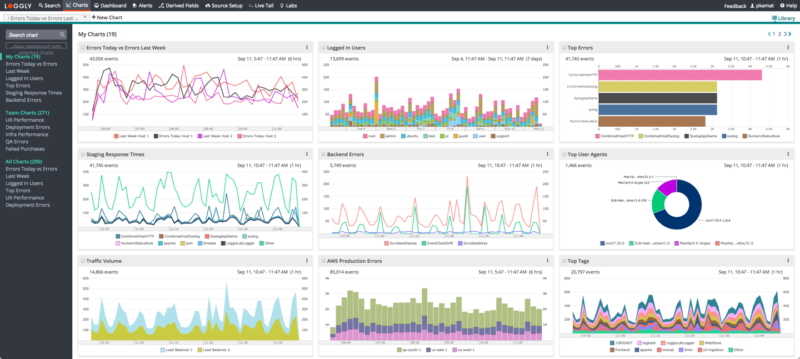
With Loggly, you don’t have to configure complex tools for visualization. It offers a pre-configured dashboard for NGINX, which helps you keep tabs on several important usage and performance metrics. The charts in the dashboard help you quickly identify a potential issue with your NGINX server, application, or code.
With a quick overview of 4XX and 5XX status codes, traffic levels, and critical events, you can resolve issues faster. Further, Loggly helps you collaborate with your team using several key integrations with Slack, HipChat, GitHub, Jira, and more. All these integrations allow your team to interact and share critical information following the best practices in DevOps.
Want something different? Try the SolarWinds Apache Log Analyzer