Technical Resources
Educational Resources
APM Integrated Experience
Connect with Us
Most traditional tools require manual log file parsing, which fails to meet the demands of modern environments where logs are produced in abundance. These tools also offer limited support for different log types.
Different log file parsers have different efficiencies; teams using free open-source versions can struggle to get the most out of their logs, and often spend more time in log analysis and troubleshooting.
While mounting hardware and storage requirements are a concern, most organizations fail to account for the hidden costs in managing and configuring their in-house log aggregation and management systems.
SolarWinds® Loggly® is an easy-to-use, scalable log management solution that enables you to dig deeper into your logs and solve nagging application problems. It saves you precious hours from not having to manually configure the parsing rules for log data. It comes with built-in support for most common log types and automatically parses Apache, NGINX, JSON, and many other types of log data.
In case your log format isn’t among our automatically parsed formats, Loggly will still allow you to log and do full-text searches. However, to harness the full potential of Loggly, it’s recommended you convert your custom logs into JSON before sending them to Loggly; you can find more information about this in our documentation.
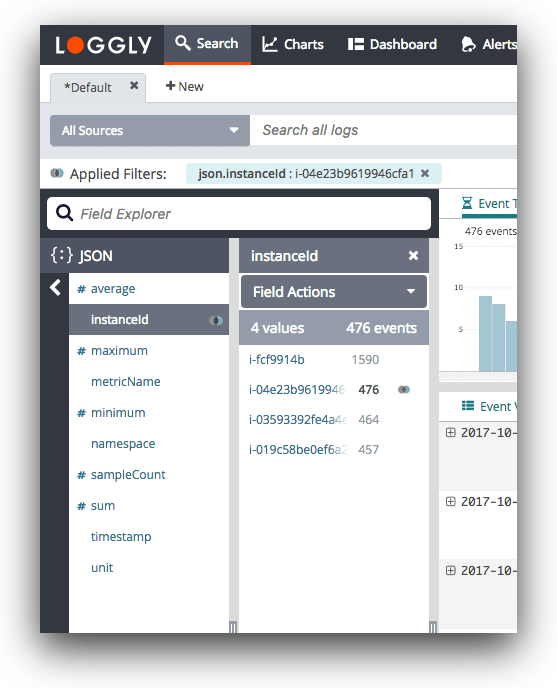
In traditional log parsing tools, parsing is done manually and often at search time, making the whole process slower and prone to errors. Loggly automatically parses your logs as soon as it receives them, extracts useful information, and presents it in a structured manner in its Dynamic Field Explorer.
This viewer provides an intuitive approach to log analysis, as you can browse through the information without typing a single command. You can click various fields and values to refine and filter out unnecessary bits. For instance, you can generate a summary of all the logs over a specific time or a particular set of hosts/users with a few clicks. This makes the whole process of log analysis highly efficient compared to CLI searches that require considerable expertise, time, and effort.
Loggly is a cloud-based log management solution that offers a better alternative to similar in-house setups by significantly reducing your time, costs, and efforts in infrastructure management. Loggly is designed to handle unpredictable spikes in log volume, helping ensure none of your critical logs are lost.
Furthermore, it’s easy to get started with Loggly, as it requires minimal configuration and doesn’t necessitate the installation of proprietary agents to collect logs from different sources. Logs can be sent directly to Loggly over syslog, HTTP/S, or any other log source (e.g., Docker, Fluentd, rsyslog). To archive logs past their retention period, Loggly can use AWS S3 buckets.
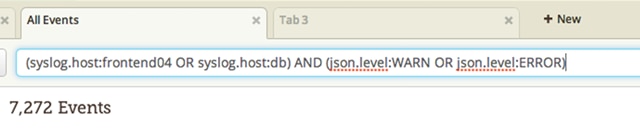
Loggly supports a simple but powerful query language for trimming down the size of your logs. And that means you can cut through the noise and focus on just the information you need when troubleshooting. Loggly’s query language is based on the Apache Lucene syntax, and it provides support for standard boolean operators such as AND, OR, and NOT. It even allows you to search for messages containing ranges of values by using the TO operator.
If you need more power to find the data you need even faster, you can use powerful regular expressions when crafting your search queries or use Lucene query types such as proximity and fuzzy matching to expand your search and locate messages with tokens a certain distance from each other.
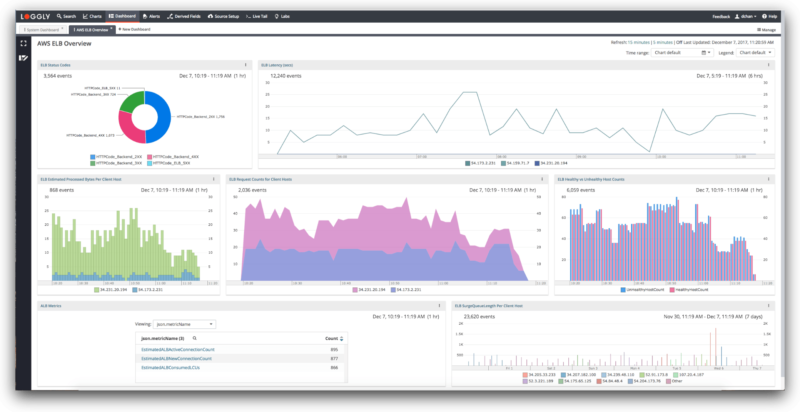
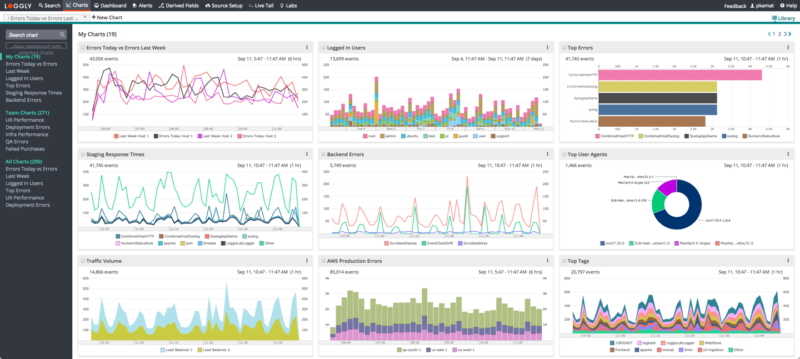
Once Loggly has ingested and parsed your log files, nothing beats visualizations for creating crystal clear summaries of your data. Spot trends and patterns over a specified time period by incorporating charts and other analytics. Interactive dashboards and reports allow you to pull together data from multiple sources and help you monitor and share key performance indicators (KPIs) with your stakeholders.
Your team members can be assigned different permissions depending on their role so they can view or modify the dashboard and collaborate together on uncovering insights. Easily search through your list of dashboards with Loggly simple manage dashboard interface, and filter the results by choosing between every dashboard, the ones you created, or only those dashboards updated in the last seven days.
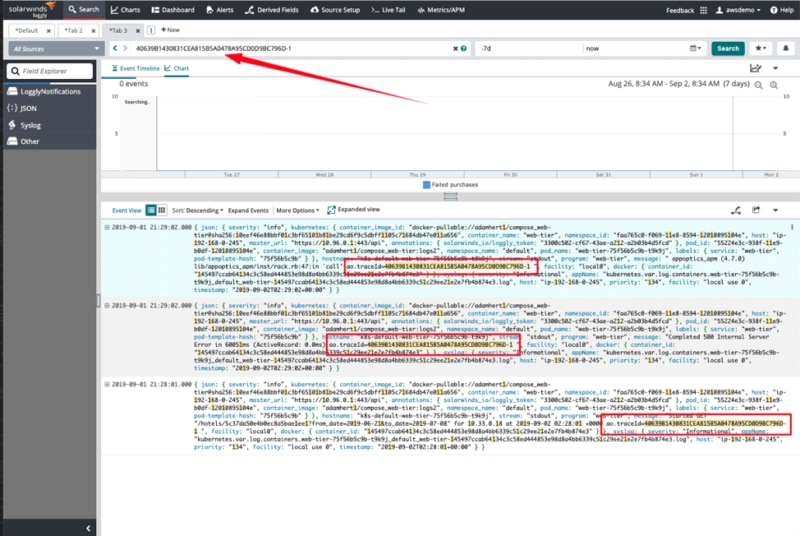
Piecing together which log messages are related to a single request to your application usually involves painstakingly reading through log data in chronological order and making several guesses. Even with the Loggly search and filtering capability, this method can significantly increase troubleshooting time.
The integration between Loggly and SolarWinds AppOptics™ allows a shared trace ID to be inserted to your logs, so you can see at a glance which log messages were generated by a request. Because this trace ID is propagated using HTTP headers, you don’t need to make any changes to your application to benefit from this feature and it works whether your app is written in node.js, PHP, or some other language. The additional trace context allows you to diagnose complex problems across software services using both AppOptics and Loggly intuitive interfaces.
Need more options? Don’t miss the SolarWinds Log Parser Tool