Technical Resources
Educational Resources
APM Integrated Experience
Connect with Us
SolarWinds Loggly allows you to centrally manage, monitor, and analyze your server, infrastructure, and application logs seamlessly. The centralized monitoring helps you easily correlate different critical events across your distributed infrastructure and resolve issues faster.
As a cloud-based service, there’s nothing to install, which simplifies the initial setup . With a choice of agent or agentless configuration, log aggregation is convenient. You can send Apache, Linux, Windows, IIS, NGINX, and any other text-based server logs to Loggly in a few simple steps. You may refer to relevant scripts and configurations related to the aggregation and management of your server logs in the Loggly documentation.

Loggly helps you search through massive log volumes and provides quicker results for your search queries. It can automatically parse your logs and allows you to define custom parsing rules to easily extract useful information from logs.
The incoming parsed logs are available for inspection under various fields and can be viewed using the Dynamic Field Explorer™ feature. It offers an intuitive interface, allowing you to click and browse through fields without needing to key in multiple commands. You can also view all occurrences around a critical event with a single click using the surround search feature.

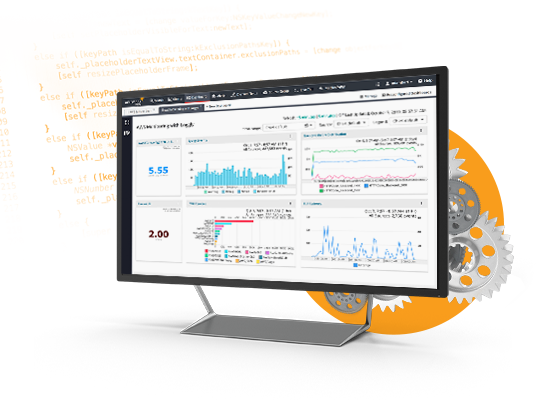
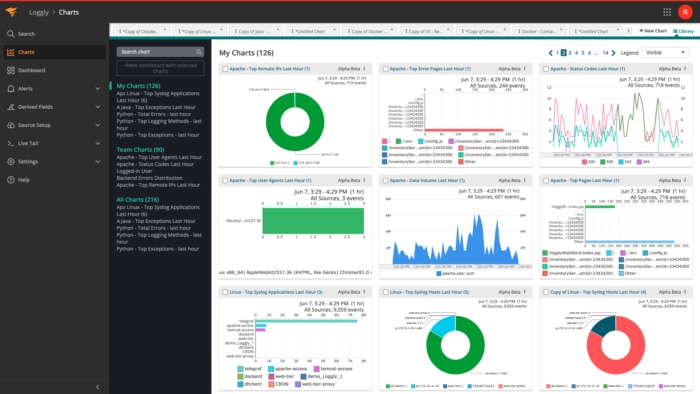
Loggly helps you monitor your environment with minimal effort using advanced visualization tools. It offers pre-configured dashboards for monitoring Apache, Linux, IIS, and NGINX server logs. These dashboards include several types of charts for a quick overview of the key performance and usage statistics related to your servers.
You can customize and share these dashboards with your team. Alternatively, you can download a dashboard in PNG format and share it over email, Slack, or another messaging service. With all these integrated features, Loggly can significantly improve your troubleshooting experience and add agility to your operations.
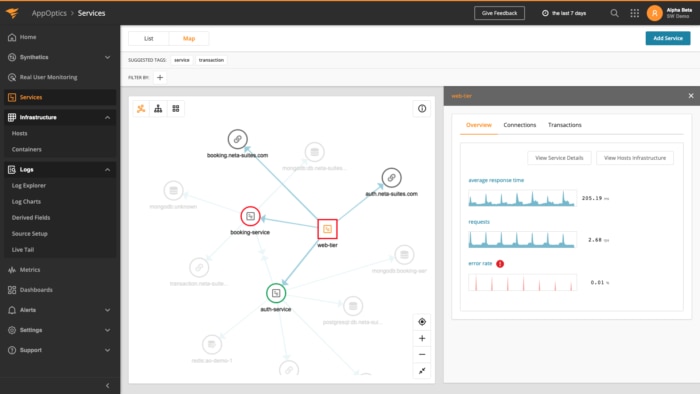
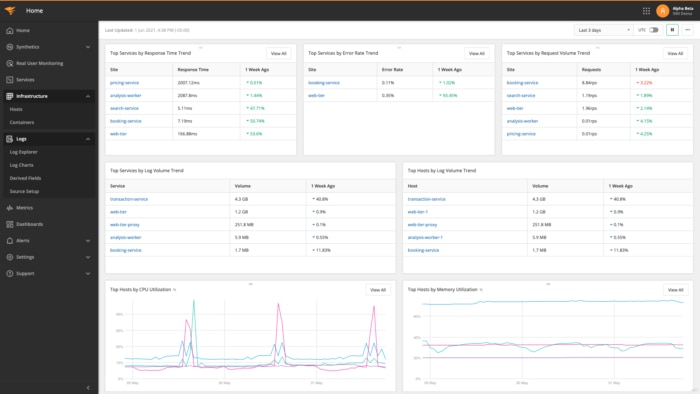
To take your server monitoring to the next level and get insights into server performance, add SolarWinds AppOptics to your monitoring toolkit. AppOptics integrates easily with Loggly and provides a unified view of server performance. It collects vital metrics from servers and applications to help you track system health and availability and help simplify the troubleshooting process. It offers built-in editing tools to customize dashboards, charts, and graphs.
AppOptics allows you to build a series of alerts that provides early warnings of events in need of immediate assistance. It can monitor multiple servers such as Apache, NGINX, dozens of AWS services, and more. The tool offers granularity and flexibility, helping ensure maximum ROI.
While Loggly offers centralized monitoring and enables teams to correlate critical events across distributed infrastructure, AppOptics provides insights into the server, infrastructure, and application metrics. Together, these tools combine to offer quick application and infrastructure monitoring capabilities to identify trends and potential issues.
This integrated suite can handle multiple servers and analyze disparate logs to ensure servers and applications are working smoothly. It provides real-time details of bugs, errors, and performance issues and automatically parses logs without requiring multiple commands.
Exploring further? You should check out the SolarWinds Server Monitoring Software