Loggly statistical alerts: Fewer false alarms, more sleep
Your alerts don’t have to be your alarm clock
Your alerts don’t have to be your alarm clock
Are you one of those people who doesn’t need an alarm clock because your application’s alerts provide needless wake-up calls every morning? Then read on.
Based on hundreds of customer interviews, I realized that it’s actually really hard to use alerts to monitor modern systems with APIs, containers, microservices, and other integrations. It’s even harder to define what kind of alerts to set. Even the most battle-hardened DevOps leader has vouched that setting up the right alert threshold is not just a mix of art and science, but also requires some luck. So it is not at all surprising to me that a plethora of recent DevOps reports have concluded that alert fatigue is one of the top two or three pain points in the industry.
Our recently released Loggly 3.0 is designed for DevOps monitoring and makes it easier for you to set the right kind of alerts and eliminate alert fatigue. In this release, we have introduced a new feature in our alerts that enables you to use statistical measures to identify sudden change. Statistical alerts give you the power to identify an assortment of issues, which if left unattended, could cause significant business impact.
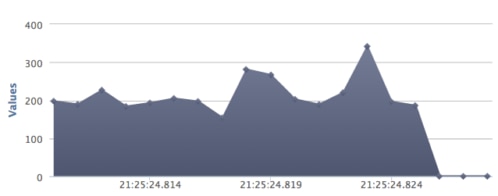
Sniff a sudden change
Seismographs can detect even the most minor of tremors in the Earth’s center. What if you had an equally sensitive tool to detect changes in your apps and user activity? Previously you had to specify a static threshold while defining count-based alerts. With our new alert feature, you can specify the threshold in relative terms using standard deviations. This statistical operator is a measure that quantifies the amount of variation in a set of data values. While a low standard deviation indicates that most of the values in the data set are close to the average, a high standard deviation indicates that they are distributed over a wide range of values.
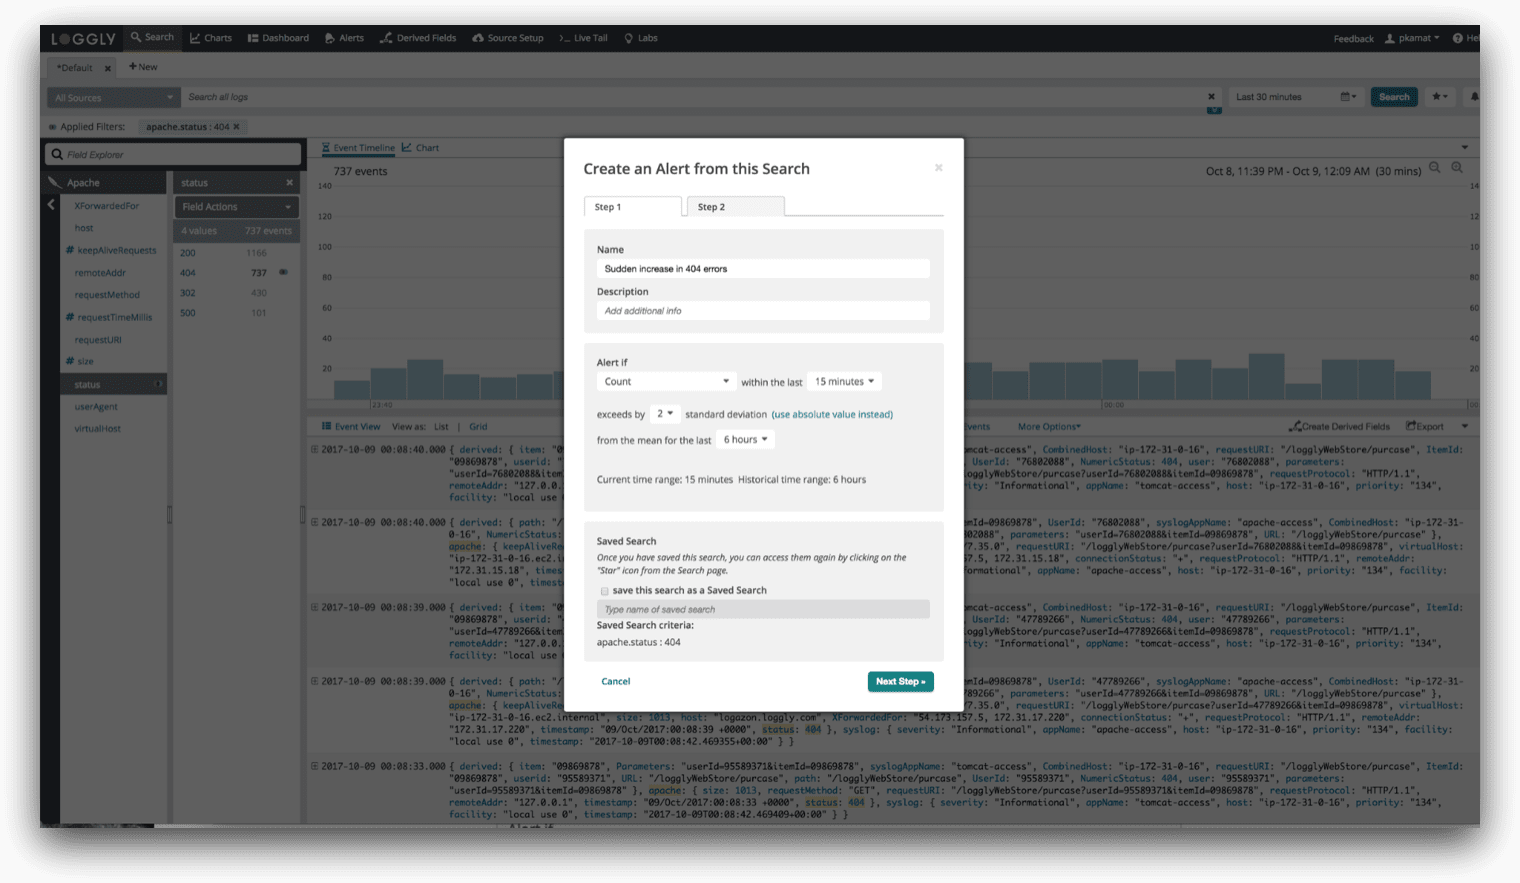
Here’s an example of setting up an alert with this new capability: Alert when the count of 404 errors in the last 15 minutes is above two standard deviations from the average for the last six hours. 404 errors are a way of life, so setting an absolute threshold often doesn’t make sense. But you would certainly want to investigate a sudden 404 spike. In this case, you can specify whether you would like to be alerted on one, two, or three standard deviations from the mean. Mathematically speaking, what this implies is that you can choose to be alerted when some values exceed 68%, 95%, and 99% from the mean, respectively.
So think of all of the services you use where you would want to know about a sudden change, and what time period is useful as a starting baseline. Here are some more examples:
- Monitoring spikes in user activity errors
- Monitoring spikes or drops in metrics such as CPU utilization, free memory, etc.
- Monitoring drops in metrics such as number of users, processed transactions, etc.
- Monitoring changes in API requests processed
Spot the oddity…
Sometimes you are not interested in rate of change, but the oddness in some system behavior. In those cases, you need both volume and a historical perspective to understand if some behavior is legitimate or if it is an anomaly. For example, say you are interested in monitoring an abnormal amount of 403 errors. You can set up an alert like this: Alert when the percentage of 403 errors in a rolling window of 30 minutes is exceeded by, say, 25% compared to the last day.

Get your real alarm clock back on track
Statistical alerting is available to all Loggly customers with paid subscriptions and all Loggly users participating in a 14-day free trial. If you’re feeling even a hint of alert fatigue, I really suggest that you give it a try.
Don’t have a Loggly account? Try it now for free!
The Loggly and SolarWinds trademarks, service marks, and logos are the exclusive property of SolarWinds Worldwide, LLC or its affiliates. All other trademarks are the property of their respective owners.

Pranay Kamat Pranay Kamat is Senior Product Manager at Loggly. His previous experiences include designing user interfaces, APIs, and data migration tools for Oracle and Accela. He has an MBA from The University of Texas at Austin and Master's degree in Computer Science from Cornell University.