Timeshift: Monitoring across time periods made easy
It is the end of October and therefore time for the Fall Classic. This year we have the Los Angeles Dodgers taking on the Houston Astros. Baseball includes all sorts of statistics. In fact, there’s even a name for it: Sabermetrics, the empirical analysis of baseball with focus on statistics that measure in-game activity.
Some of you, like me, may have always wondered how “The Bambino” would have fared in today’s era. Would he still have clobbered 714 home runs against Clayton Kershaw, Jake Arrieta, and Madison Bumgarner? Would Jose Altuve, Mike Trout, and others have allowed Christy Mathewson to pitch three complete game shutouts in a World Series? How would Barry Bonds fare in the dead ball era with no pitch counts? Unless you actually see them play in different eras, who knows, right?
Thankfully, in the world of logs and metrics, DevOps teams can now use Loggly 3.0’s Timeshift capability to compare the same metric across time periods. Shift your time-based data series by a specific amount of time and plot both the original series and the timeshifted version on the same chart.

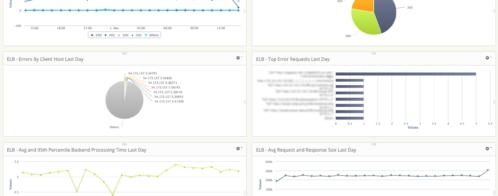
With Timeshift, you can easily compare your key metrics, such as latency, web server requests, and number of users logged in, for different time periods and plot on the same chart. Once you add it to a dashboard, you can create and share reports such as:
- Hour-over-hour
- Day-over-day
- Week-over-week
Why would you be interested in doing that? Timeshift is a great way to identify whether or not system behavior has changed.
Imagine a situation where you had a maintenance window over the weekend. If you have a week-over-week chart showing the number of errors or 95th percentile for latency, you can quickly determine if the maintenance window improved or degraded system behavior. If something strikes you as odd, just copy a permalink to the chart or dashboard and share it with your team via HipChat, Slack, or email.
Want to see how Loggly 3.0 makes monitoring so easy? Take it for a test drive. Or else, just enjoy a timeless rendition of “Take Me Out to the Ball Game” from way back in 1908!
The Loggly and SolarWinds trademarks, service marks, and logos are the exclusive property of SolarWinds Worldwide, LLC or its affiliates. All other trademarks are the property of their respective owners.

Pranay Kamat Pranay Kamat is Senior Product Manager at Loggly. His previous experiences include designing user interfaces, APIs, and data migration tools for Oracle and Accela. He has an MBA from The University of Texas at Austin and Master's degree in Computer Science from Cornell University.