Technical Resources
Educational Resources
APM Integrated Experience
Connect with Us
Teams have to keep track of multiple devices, applications, in-house infrastructure, and cloud. In the absence of a scalable remote log server, teams can struggle to accrue their logs’ true benefit.
While text logs hold key insights, manual processes for searching and analyzing these logs can take up a lot of time. Teams lack advanced remote logging tools that can expedite troubleshooting.
To use charts, dashboards, alerts, and more, teams have to configure and shuffle between multiple tools. They lack access to a remote logging service which offers out-of-the-box troubleshooting.
As a cloud-based log management and analytics service, SolarWinds® Loggly® helps development, operations, customer service, and marketing teams in remote logging and getting useful insights from their logs.
The highly intuitive interface and powerful features of Loggly make it ideal for modern organizations with a distributed stack. It has an agentless architecture, which means you don’t have to install any proprietary software to send logs to Loggly. You can transmit all logs without any elaborate configuration using syslog (TCP, UDP, TLS) or HTTP/S. Loggly also accepts logs from AWS scripts, Docker, Fluentd, JavaScript, JSON, rsyslog, and plenty of other logs sources.
Loggly helps you trace issues in a distributed stack and find the root cause in a quick and simple way. It offers automated parsing covering a wide range of log types, and provides near-instant responses for searches over massive data volumes.
Your team doesn’t have to learn any proprietary query language to perform full-text searches, quests by individual fields, ranges, and booleans. Moreover, the Loggly dynamic field explorer presents a structured summary of your logs, allowing you to click and browse through data without typing multiple commands. The explorer improves troubleshooting speed significantly and helps you gain quick insights.
Unlike self-hosted setups where teams must configure remote logging services and integrate multiple open-source solutions, Loggly simplifies log management and analytics with advanced charts, dashboards, alerts, and other useful features.
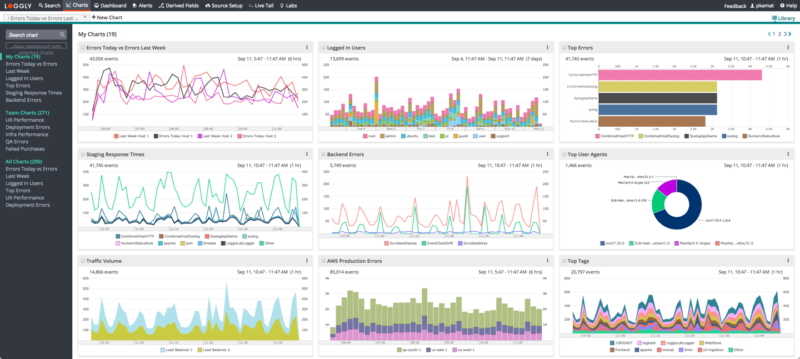
You can visualize your search results with a variety of charts that can be combined in shareable dashboards. This helps to find hidden patterns, trends, and anomalies with ease. Furthermore, you can set alerts in Loggly and receive notifications over email or popular notification services like Slack, HipChat, PagerDuty, and more. All these features help you and your team stay on top of your distributed environment and applications
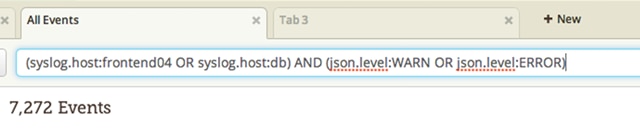
Working with huge volumes of log data is easy with the remote logging service from Loggly, thanks to its simple query language that enables you to search quickly and efficiently. The language is based on Apache Lucene and includes standard boolean operators such as AND, OR, and NOT, and even a TO operator that lets you search for ranges of values in your log data. The TO operator is perfect creating succinct queries to find all logs messages that contain the full spectrum of HTTP response errors codes or all messages above a logging level.
Because Loggly knows how to parse many common log formats, you can search for values in specific log format field names, such as Apache’s ‘status’ field for HTTP status codes or the syslog ‘hostname’ field for the hostname of the syslog server.
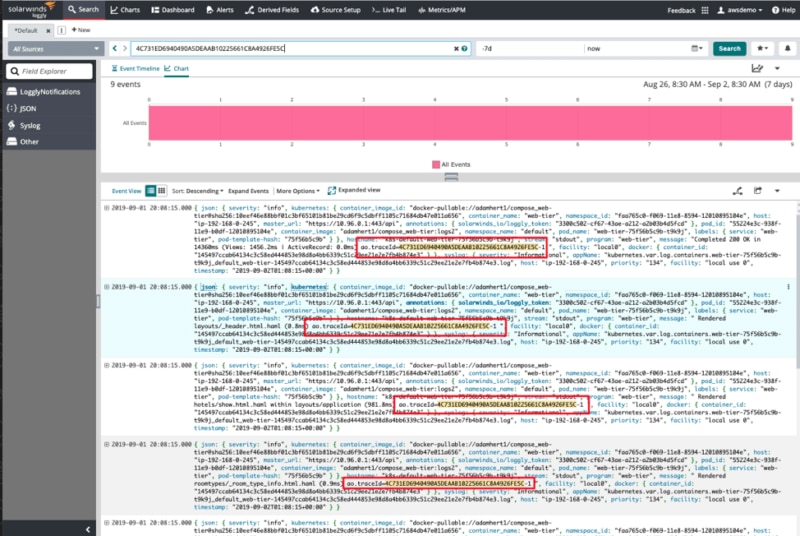
When issues arise in applications that use multiple services, diagnosing exactly what’s going wrong usually involves making assumptions based on the order log messages appear in your aggregated log files. Instead of debugging based on guesses, the integration between SolarWinds AppOptics™ and Loggly lets you find related log messages using a shared trace ID to enable you to precisely correlate log messages with individual requests. That makes troubleshooting much faster because you can find the origin of exceptions and errors. You don’t need to modify your software to take advantage of this integration.
Trace IDs are inserted into your log files automatically and propagated using HTTP headers. It doesn’t matter whether your app is written in node.js, PHP, or some other language—trace IDs can help you track messages throughout your software.
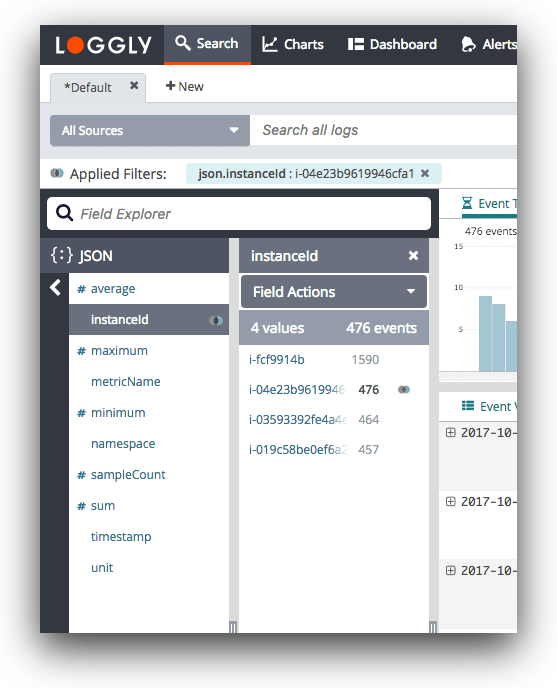
With the Loggly Dynamic Field Explorer feature, you can see a structured summary of your log data and quickly discover the list of field names and frequency of individual values, which enables you to build a map of your data and uncover patterns as well as anomalies. Using the simple interface, you can rapidly refine the information you’re searching for, hone in on the results you need, and filter out the noise.
The Dynamic Field Explorer provides a much faster way to search through your data if you’re not sure where to start or what queries to create. So you never have to start from a blank search page or hope you’ll find what you need by trial-and-error
Want something different? Try the SolarWinds SEM