Technical Resources
Educational Resources
APM Integrated Experience
Connect with Us

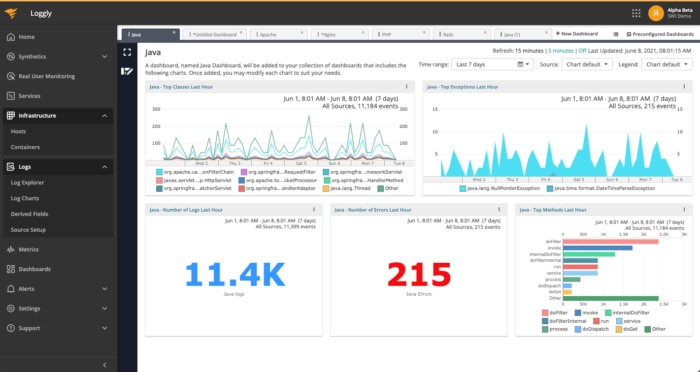
Teams often rely on third-party frameworks like Log4J, Logback, and tinylog for Java log management. These frameworks use the java.util.logging API to simplify the application development process. However, once the application moves into production, it becomes challenging to manage logs generated via these applications.
Developers have to maintain and manage their servers for logging, distracting them from their actual work. Furthermore, the frameworks don’t typically offer help in monitoring and analyzing Java logs. A cloud-based log management service like SolarWinds Logglyis a common approach for centralized log management. Loggly makes it possible for you to stream logs from your Java-based projects and analyze them along with other application and infrastructure logs in a unified manner.
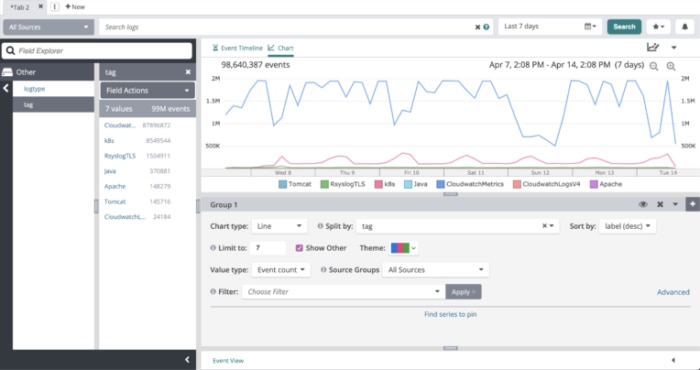
To analyze production logs in distributed setups where log volumes can multiply rapidly, you need monitoring tools built to scale and deliver reliable log management and analysis. For instance, Loggly can parse logs automatically.
As log parsing breaks information into smaller chunks of data, it becomes easier to find accurate results for your log searches. Furthermore, Loggly includes the Dynamic Field Explorer™ feature to simplify the troubleshooting process. It provides a structured summary of all the parsed logs and crucial information such as identified field names, the inherent structure of logs, and the frequency of individual values. Integrate Loggly instantly with tools like Takipi to detect the root cause of the issues.
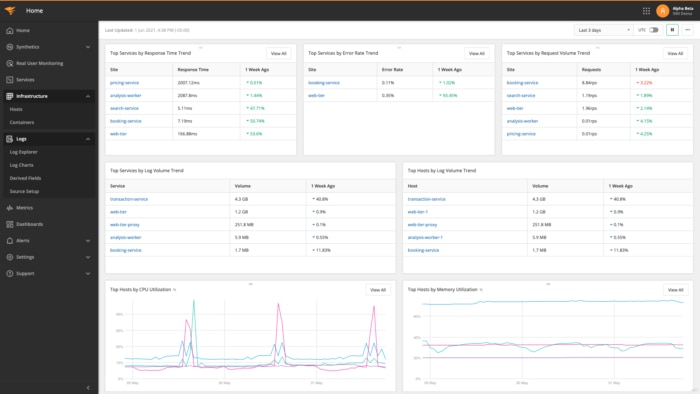
Loggly is a full-stack, multi-source log management solution that provides visibility across the application logs to accelerate troubleshooting. It includes pre-configured shareable dashboards for a centralized view of application logs and seamless team collaboration. It also offers different chart types to help you visualize unified data for deeper and faster log analysis. These interactive charts help you spot anomalies and detect trends faster to resolve issues in real-time.
Loggly provides a graphical representation of trends and patterns to help track application behavior over time. Moreover, an anomalies chart helps you identify how different metrics behave based on patterns, trends, and more. These charts enable you to monitor metrics with strong trends and recurring patterns that are difficult to monitor with threshold-based alerting.
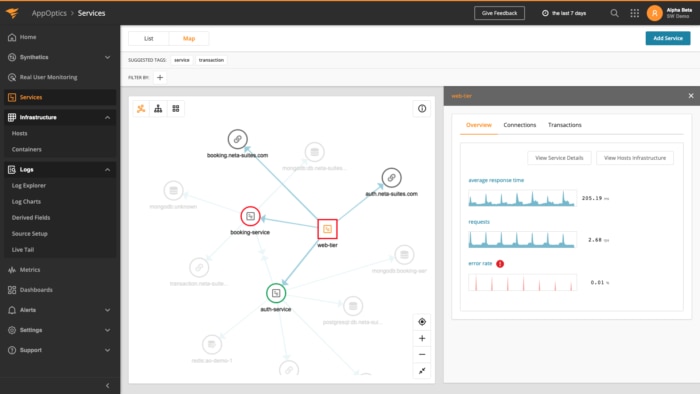
Get powerful insights to monitor, track, and optimize the performance of Java applications and web infrastructure with AppOptics. Leverage the distributed transaction tracing feature in AppOptics to track the path of the entire request and quickly identify the link between bottlenecks and user impact. It also helps you visualize the end-to-end behavior of individual requests in real-time. AppOptics also has exception tracking and live code profiling, providing a powerful set of code-level troubleshooting capabilities.
AppOptics features over 150 out-of-the-box integrations, including dozens of AWS and Azure services, and pre-configured plug-ins to enhance application performance. AppOptics makes it possible to set alerts and get instant notifications about slow queries, application downtime, and inefficient code. It also provides a high-level view of infrastructure resources such as CPU utilization, storage, and more.
Together, AppOptics and Loggly provide deep visibility into applications and infrastructure. This helps you troubleshoot issues faster by reducing mean time to resolution. While Loggly parses logs or events, AppOptics monitors the health of your critical systems and applications with features like distributed tracing, live code profiling, and exception tracking.
Leverage advanced analytical features of this APM suite to gain insights into key performance indicators of your applications. Set threshold-based alerts to get notified about issues or downtime of highly distributed cloud applications. Use the product suite to correlate APM metrics to infrastructure KPIs and track them down into individual host logs. The suite provides full observability into how the application is running on your infrastructure.
Need more options? Don’t miss the SolarWinds Java Application Monitoring.