Technical Resources
Educational Resources
APM Integrated Experience
Connect with Us
It is not easy to aggregate and analyze logs from all of the applications and services running on a Kubernetes cluster. Log volumes can quickly multiply and become unmanageable.
Setting up, managing, and scaling up ELK to meet your logging needs is a complex task requiring much time and effort. This can distract your team from other high-priority tasks.
Teams are often forced to use multiple open-source tools to visualize their logs. Also, a lack of integrated tools for collaboration makes the whole process slow and complex.
Most teams operating in the Kubernetes environment often use kubectl to tail logs. However, this method is prone to security issues as it requires direct access to the cluster. Another major challenge with the Kubernetes environment is that logs can multiply rapidly. Teams lacking scalable logging solutions are at risk of losing critical logs during a spike.
To make things easier, Kubernetes offers a simple approach for in-cluster logging that allows transmitting logs from your pods to Elasticsearch. You can use the same approach to send logs to SolarWinds® Loggly®, along with all its host tags. The advantage with Loggly is that you can aggregate all your logs in one place, access them via a web interface, and control their access per your organization’s policies. This makes Kubernetes logging highly secure and reliable.
While you can set up ELK in the Kubernetes cluster, there is no straightforward way to scale ELK for ingestion and searching needs. On the other hand, Loggly streamlines the whole process with advanced features for searching and analysis.
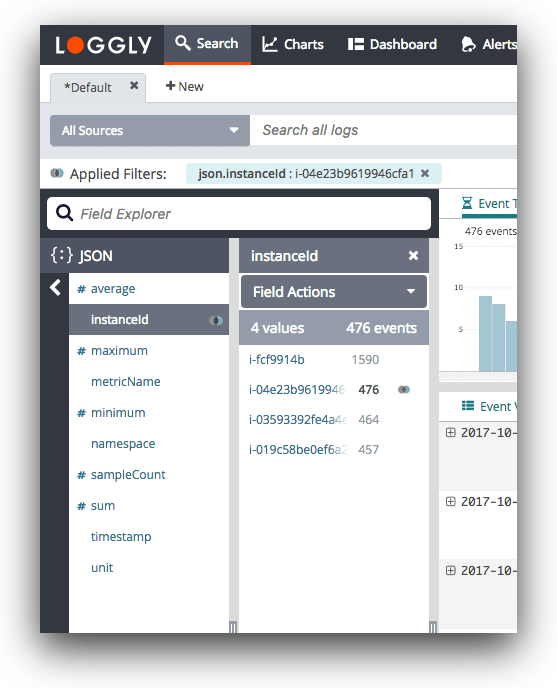
Loggly automatically parses incoming logs to provide near-instant search results. It provides your log information in a structured manner with its highly interactive Dynamic Field Viewer. With this viewer, you can browse through your logs without any need to key in multiple commands in the console. You can also use the Fluentd plugin to cover all relevant Kubernetes tags for detailed analysis.
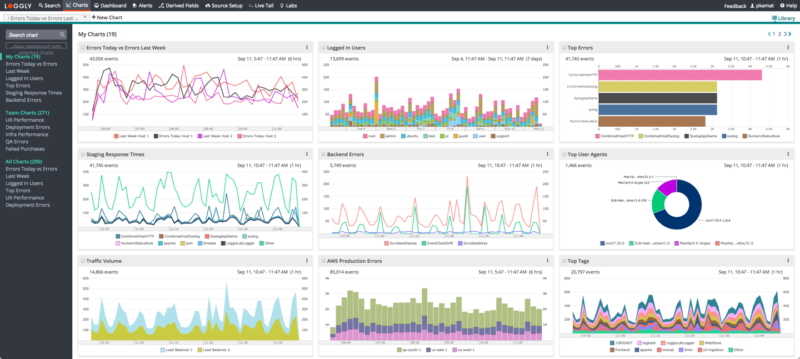
In addition to simplifying Kubernetes log aggregation, Loggly offers advanced charts and dashboards for quicker analysis and troubleshooting. The interactive charts can easily be shared through dashboards, which helps you keep every team member on the same page.
Also, you can click on any spike in these charts to explore associated logs and drill down to the code to fix issues. This allows you to spend more time running your applications instead of running the infrastructure. Loggly ensures smooth collaboration for your DevOps team using multiple integrations with tools such as Slack, GitHub, Jira, and more.
Exploring further? You should check out the SolarWinds Log Aggregation Tool