Technical Resources
Educational Resources
APM Integrated Experience
Connect with Us
Traditional open-source logging tools require teams to set up their own log aggregation server. These tools also need several integrations and often have a lengthy configuration; managing this complex setup is a resource-intensive task.
Modern enterprises have their data spread across a multi-cloud environment with numerous endpoints. Traditional tools are not designed to handle massive log volumes arising from such distributed setups and can get painfully slow when searching older logs.
While managing logs in one place has its benefits, finding useful information in these text logs is not easy. Traditional log aggregators offer little help when it comes to searching and analyzing the logs for troubleshooting and reporting.
Unlike traditional log file aggregation tools, setting up SolarWinds® Loggly® is extremely fast and simple. Its agentless architecture ensures that you don’t have to install and log an extra piece of software for pulling logs from any log source. You can send logs to Loggly over syslog or HTTP/S or from any other log source (e.g., Docker, Fluentd, rsyslog).
While the centralized management of logs makes things simple, the cloud-based setup also offers easy scalability to handle unpredictable spikes in log volume. This ensures that none of the critical log data is ever lost. When logs get past the log retention period, Loggly can store them in AWS S3 buckets. Here, logs can be retained as long as you want them for compliance, or any other requirement.
Loggly gives you the ability to unify all your logs in one place and search across the entire stack with near-instant results. An interactive interface and comprehensive search capabilities with a simple query language further reduce time in troubleshooting.
Loggly parses your log data as soon as it receives it, not just when you conduct a search. This means that it can map the structure of your logs in near real time, enabling you to quickly and easily browse your logs. This visual view guides you to where to look for operational problems, and exposes issues from places that you might miss otherwise.
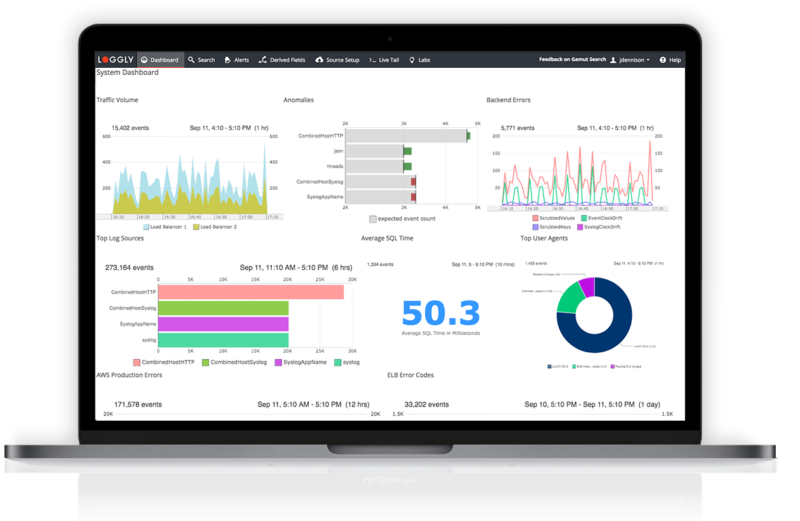
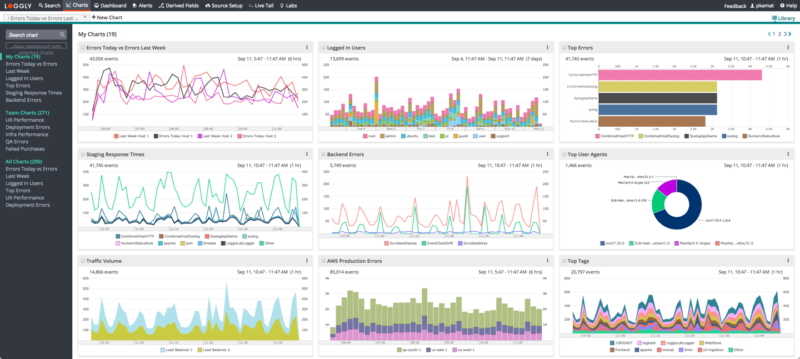
Loggly simplifies troubleshooting with many advanced charts and interactive dashboards. The charts help you visually monitor text logs, which makes it simple to spot trends and find patterns over a period. These charts can be displayed on shareable dashboards, unifying infrastructure and application data in one place for easy correlation. You can click a spike in the dashboard to find associated logs for deeper troubleshooting.
The timeshift function helps you monitor key trends over a period and the anomaly chart helps in early detection and mitigation of issues. Loggly also offers easy integration with popular notification services (i.e., Slack, Hipchat, Pagerduty) for alerting. Furthermore, Loggly can help in reducing alert fatigue by offering a better approach over traditional, count-based threshold alerts.
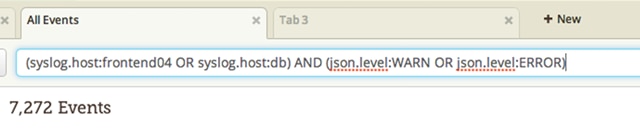
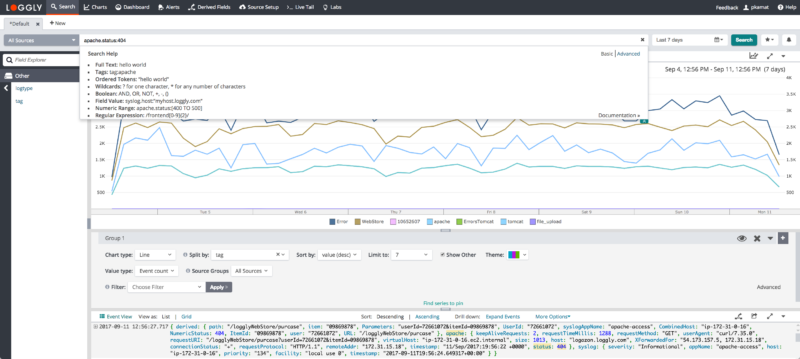
If you’re searching through a sea of log data to find the clues to troubleshoot a problem, you need a simple but powerful query language to dissect your data. Loggly supports a search query language that’s based on the Apache Lucene syntax. It allows you to create search queries that filter out unwanted log messages using standard boolean operators such as AND, OR, and NOT, and even find log messages matching a range of values with the TO operator.
Loggly knows how to parse many common log formats and the query language allows you to build more complex queries to search for messages with values in format-specific fields. This feature is perfect for matching all messages in an Apache log with a predetermined status code, or locating all Syslog messages from a certain host.
Finding related messages in large log files when debugging complex performance problems can be extremely difficult, especially when messages from multiple sources are mixed together.
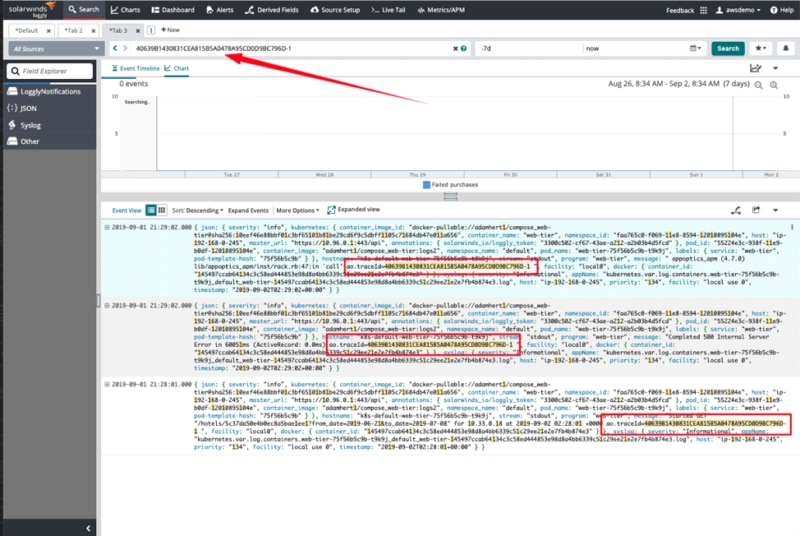
Loggly integrates seamlessly with AppOptics to insert additional trace context into your logs, which enables you to correlate related log messages. This means you can narrow your search to just the events relating to a single request to your application. This feature doesn’t require you to modify your existing code. Instead, the integration between Loggly and AppOptics uses HTTP headers to propagate context across your services, so it doesn’t matter whether your application is written with node.js, PHP, or another language—you can trace exceptions, errors, and requests across your software components.
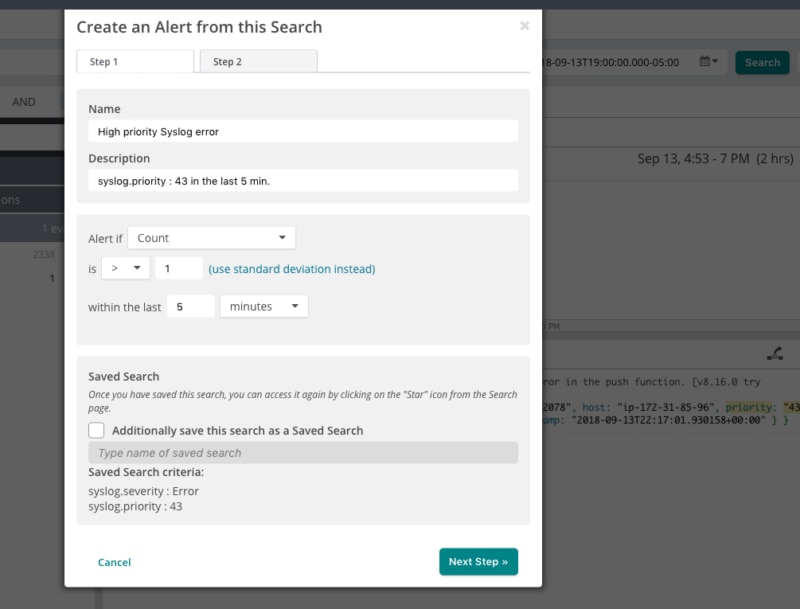
Instead of manually running searches to monitor important metrics, you can use alerting and monitoring features in Loggly to schedule a time to run your saved searches. Use the Loggly simple query language to build powerful queries reporting on the metrics important to your business, and receive instant notifications whenever the alerts trigger.
With support for a range of notifications endpoints, you can use alerts to proactively monitor your software and discover issues before your users do. You can configure multiple endpoints for each alert, so you can always be sure the right team will be alerted. And if you need to include data with a notification, you can also send the 10 most recent events to your alert endpoint.
Knowing which search query to create when investigating an issue can involve much staring at a blank search page. With the Dynamic Field Explorer™ feature, you’re able to understand your data faster by viewing a structured summary of all your logs. This feature maps field names and the frequency of values to reveal the most common events, highlight anomalies, and filter out all the other unwanted noise.
By continuously refining your search, Dynamic Field Explorer allows you to quickly hone in on the data you need without using a time-consuming trial-and-error method, meaning you’ll be able to uncover insights in less time with less effort and without having to learn a new search language. Dynamic Field Explorer provides the perfect ‘guided search’ experience.
Looking for something else? You might also want to check out the SolarWinds Log Aggregation Tool