Technical Resources
Educational Resources
APM Integrated Experience
Connect with Us
SolarWinds Loggly offers cloud-based log analysis and aggregation, which makes it simple for IT teams to centrally monitor and analyze their infrastructure and application logs. It provides a reliable alternative to a similar self-hosted logging setup that can be difficult to scale up and manage.
With Loggly, you can enable NGINX remote logging and get alerts to troubleshoot critical issues quickly. Setting up Loggly doesn’t take hours, and you can start analyzing logs without elaborate configuration. You can send NGINX logs to Loggly using syslog daemons such as rsyslog. For long-term log archival, you can use AWS S3 buckets.
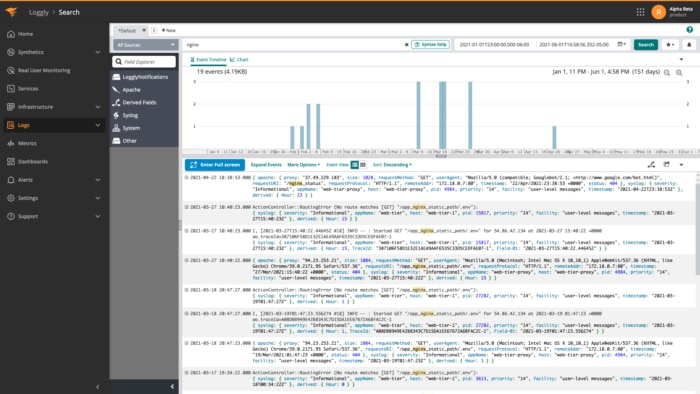
Loggly simplifies NGINX log monitoring and helps you discover rogue processes and resolve issues faster. It offers a powerful search feature designed to filter out normal events and focus on the events that matter. And Loggly was built to search and analyze large event volumes, so there’s no worry about overwhelming your log search when there’s a spike in error messages. It can also automatically parse your logs into various fields for advanced analysis and visualization.
You can browse through your logs using the Loggly Dynamic Field Explorer™ feature, which can significantly boost your troubleshooting experience. Loggly allows you to inspect all related logs surrounding a critical event with surround sound, which makes it easier for you to get to the root cause of issues faster.
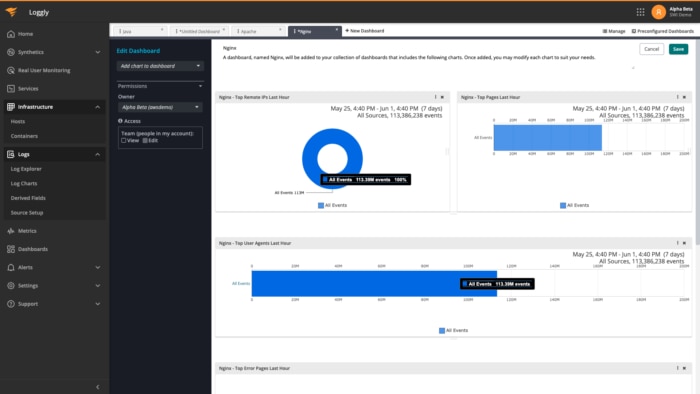
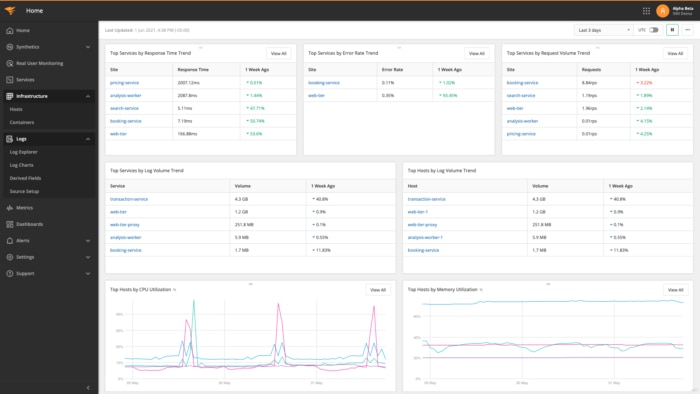
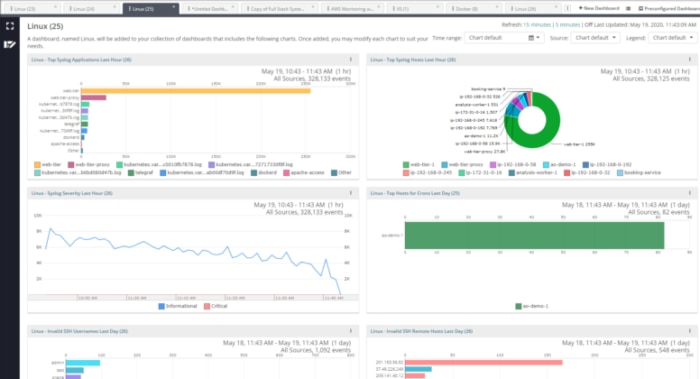
Loggly allows you to analyze your logs visually with minimal effort. It offers a preconfigured dashboard for you to monitor key performance and usage statistics. With this dashboard, you can easily spot spikes in 4XX and 5XX status codes, which can indicate a potential issue with your application. From there, you can drill down to inspect unusual traffic patterns or check all related events to find the root cause of issues.
For collaborating with your team, you can define access permissions and share the dashboard with your team member. It’s also possible to download Loggly dashboards in PNG format for reporting purposes.
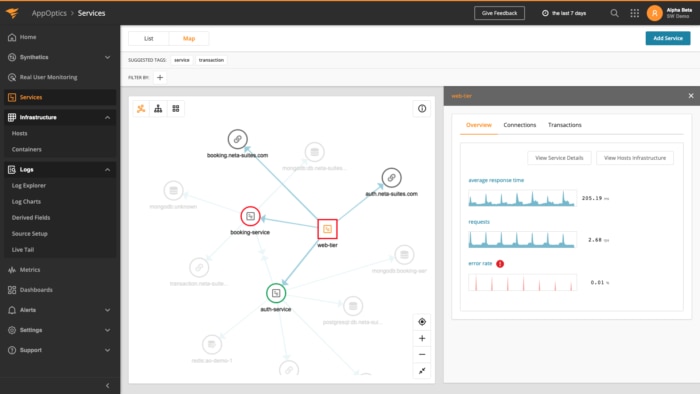
NGINX is a complex web, HTTP, and reverse proxy server with a range of capacities and functionalities. Monitoring NGINX helps to identify server availability and performance issues to ensure end users get uninterrupted access to the applications. AppOptics, with its preconfigured dashboards, helps you visualize critical metrics, client connections, and traffic workload in real time.
With its detailed trace summaries and service maps, it’s easier to determine where issues are and monitor the entire stack. This also helps in reducing the mean time to resolution. AppOptics intelligent alerting automatically notifies IT teams whenever critical performance thresholds are reached. The solution provides 150+ out-of-the-box integrations, and AWS and Azure services to reduce complexity and smooth application functionality.
Didn’t find what you were after? Consider the SolarWinds Node.js performance monitoring