Your Log Files on Steroids: Cut Debugging Time Without Writing a Single Line of Code
I was amazed how Takipi enriches logs by linking additional debugger info. I invited one of their engineers named Alex Zhitnitsky (@takipid) to write a guest post so you could hear their story. – Jason Skowronski, Product Manager at Loggly
Alex is an engineer working at Takipi on a mission to help Java and Scala developers solve bugs in production and rid the world of buggy software. Passionate about all things tech, he is also the co-founder & lead of GDG Haifa, a local developer group. Alex holds a B.Sc from the Technion, Israel’s Institute of Technology.
The Takipi Story
Takipi tells Java developers when and why code breaks in production. It detects caught and uncaught exceptions, HTTP and log errors, and it shows the code and variables that caused them.
Finding An Error In Production
One of the most important things we do after a code deployment or change in site volume is monitor our web server metrics. We want to make sure our users’ pages are loading correctly, and this is especially tricky when following continuous integration practices. For this mission, we’re using modern monitoring tools like New Relic and Loggly.
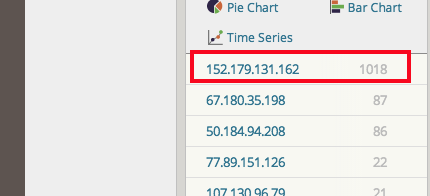
A great way of keeping an eye on our status codes and response time metrics, is by integrating Takipi with Loggly. We’re using Loggly to summarize the critical logging metrics in Loggly Dynamic Field Explorer, which is continuously refreshing this information in real time. In the pie chart below, you can see error codes are being generated by almost 40% of the site traffic. Let’s dig in and find out what’s causing this.

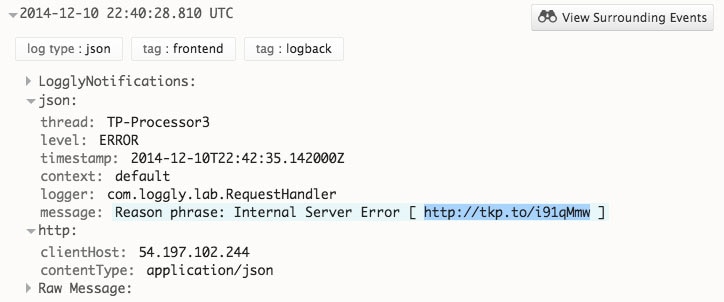
I found an example error log, then searched Loggly for the request ID to find the specific error message. I discovered that the error message came from a Java application server. Specifically, it came from the RequestHandler class. However, this error message isn’t very descriptive, so I’m still unsure what the problem is. Luckily, I see a link to Takipi inserted in the message.
Using Takipi To Find the Root Cause
Takipi gives me access to much more information to find the root cause of this problem. After I open the Takipi link, I can see the RequestHandler code along with the variables that caused this error. Here I can see the code is making a request to a REST service which returned an exception.
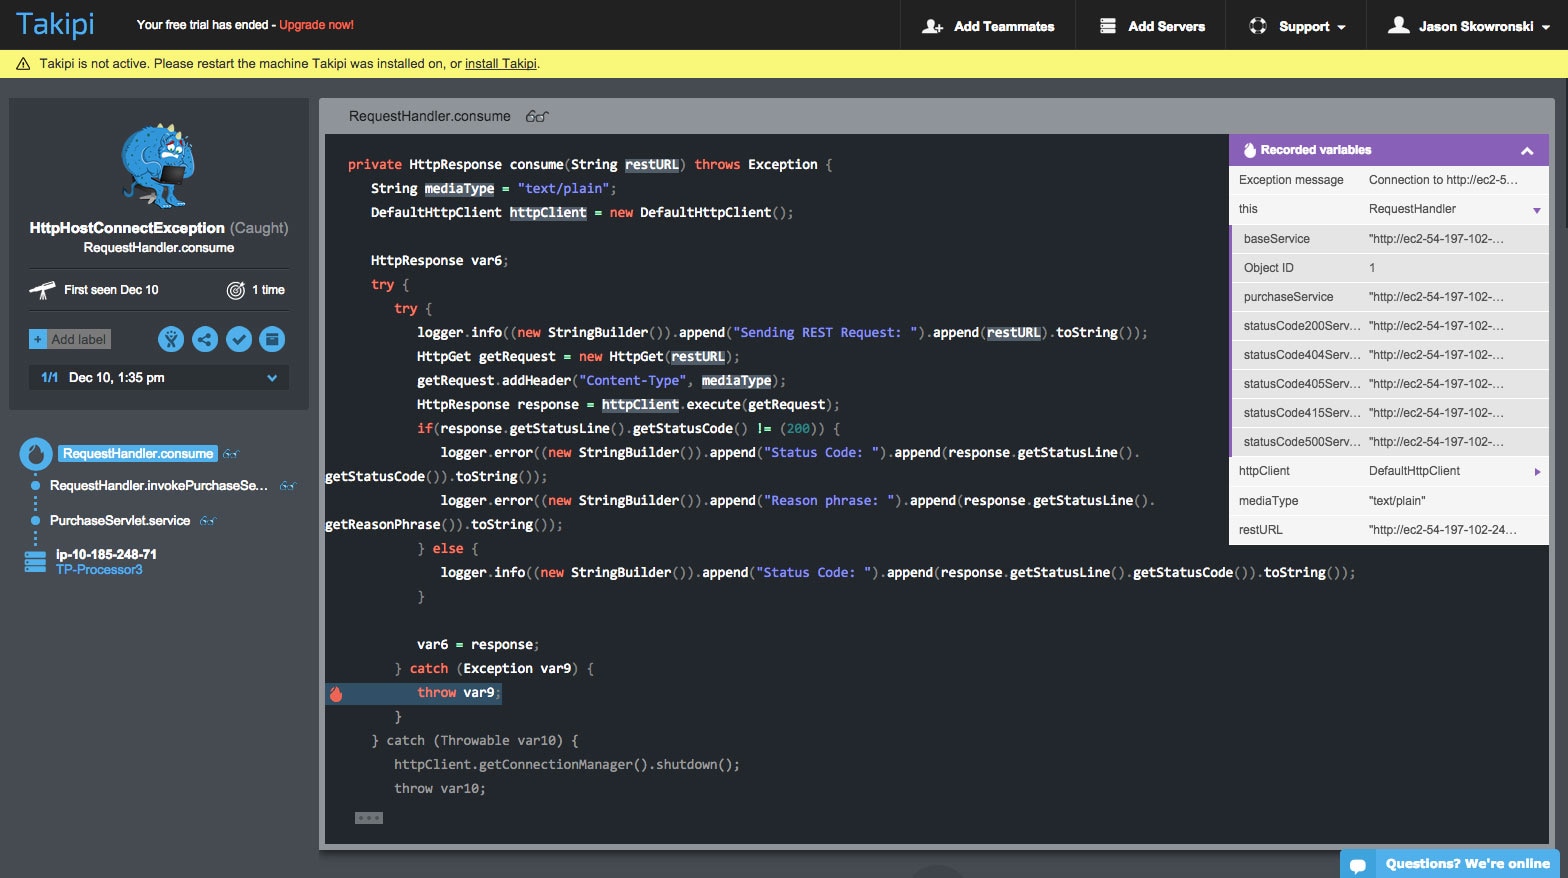
Tracing the request through to the REST service, I hover over the items variable to see that it got no results back from the database (see screenshot below). It then tried to load an item from an empty array causing the exception. This is clearly a bug that needs to be fixed, and I have been able to identify the cause in just a few minutes.

Takipi can show me:
- The stack trace with all the methods that led to the exception or logged error.
- All the machines and threads that were involved.
- The exact location in the code where the error happened.
- The variable state that caused the error, all across the call stack.
- And… multiple instances of every error, to better understand what happened.
If an exception happens more than once, I can toggle between different recordings and compare their stack and variable values.
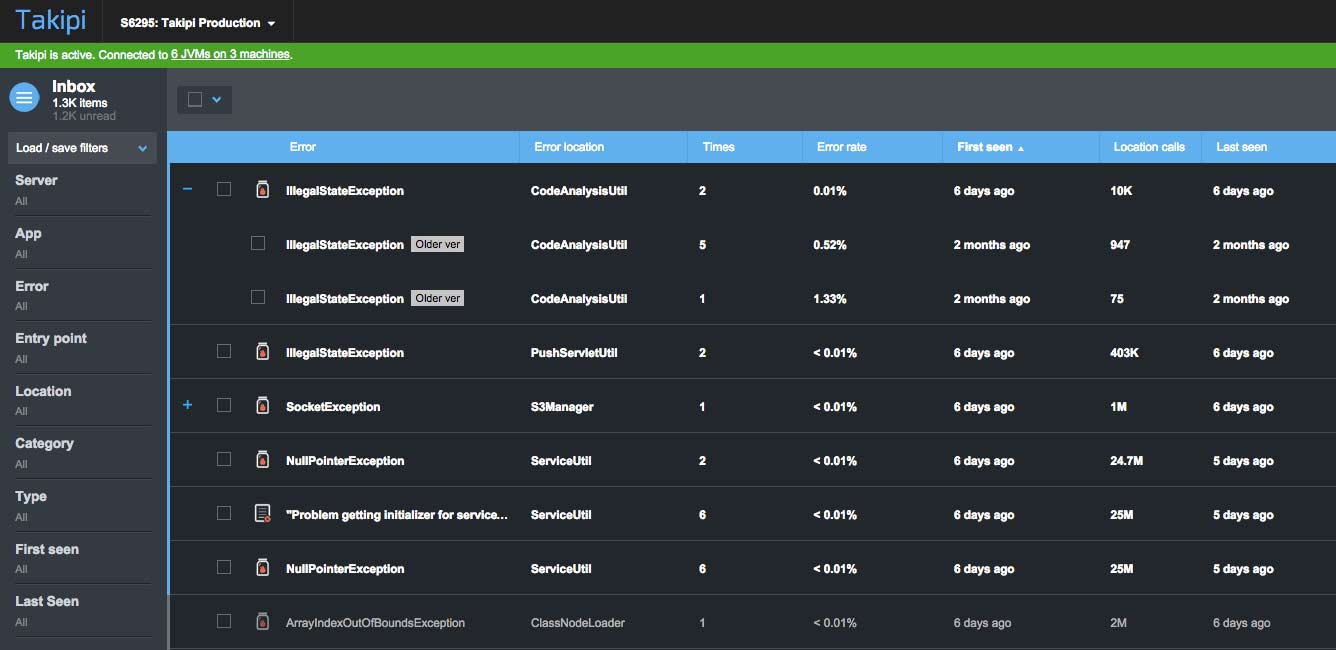
On top of displaying logged errors, the Takipi dashboard shows me all the exceptions that were thrown on my machines, even ones that haven’t been logged. I can see all of them in the dashboard, share errors with teammates, and mark errors that I’ve already fixed. Once I solve an error, Takipi will let me know if it happens again. If you’re using Takipi for continuous integration, you can get even more out of it as you’re able to see the impact of new deployments on your code in real time.
Conclusion
The more data you have, the faster you can solve an error using the right tools. Loggly makes it easy to monitor server uptime and performance as well as to identify issues early and isolate their cause. Takipi helps you diagnose these errors by showing instances of variables right alongside your code. Both are essential tools when you have millions of events generated by a bunch of different machines, multithreaded errors, and errors involving third party libraries. These kind of environments are where Takipi and Loggly can help you get the most intelligence from your logs. You can stop guessing at what causes errors and see exactly what happened.
The Loggly and SolarWinds trademarks, service marks, and logos are the exclusive property of SolarWinds Worldwide, LLC or its affiliates. All other trademarks are the property of their respective owners.

Alex Zhitnitsky