Technical Resources
Educational Resources
APM Integrated Experience
Connect with Us
Many web developers need to develop an application in a short amount of time and can take advantage of some of the many frameworks available. I use Django because it has a wide variety of modules ready for use. Also, it scales easily, and many big companies use it and support its development. In addition, it’s easy to integrate many third-party modules. And with any app, you need logging.
During the development process, you need a way to track the code flow and the way some variables change. And you’ll need a way to spot errors as they arise. Of course, that’s what the debugger is for. But there won’t be the same facilities after you release to production. The solution is logging and log management.
An effective logging tool can enable you to easily track errors, monitor your application health, and improve your application help. SolarWinds® Loggly® can adapt to your needs and make your application more resilient. There’s also a free trial if you’re interested.
To help you better understand the usefulness of Loggly, let me show you an example.
Let’s say you have an application built in Django, and its main purpose is to track client payments for the services you provide to them. Its some secondary features include user management and client contact information management.
The application parses invoice files and then assigns a person to track invoice status, make client calls reminding them of pending payments, and keep a log for all user and client interactions.
It doesn’t seem like a difficult application. You implement user login, then a screen to add files, and finally a screen to view and edit invoice tracking data.
But then, your business grows, and you need to handle more users, clients, and files. So, instead of loading contacts or invoices by hand, you enable batch uploads and a network share to have a single place to load files. Additionally, you put a file monitor in the share to load automatically every file saved on it.
Tracking errors in this scenario won’t be easy, as there will be many error sources. So, let’s use Loggly to help us. First, I’ll show you how to configure it in Django, and then I’ll show you its value.
If you need more detailed information than what I’m presenting in this article, you can review Loggly documentation.
To use Loggly with Django logging, first you need to set up rsyslog, executing the following commands:
curl -O https://www.loggly.com/install/configure-linux.sh

sudo bash configure-linux.sh -a SUBDOMAIN -u USERNAME
The above commands will configure logging and send Django events to Loggly. USERNAME is your Loggly username, and SUBDOMAIN is the subdomain configured when setting up your account.
Now create a new rsyslog configuration file for Django.
sudo vim /etc/rsyslog.d/21-django.confAdd the following content:
#provides UDP syslog reception

$ModLoad imudp

$UDPServerRun 514
#Add a tag for Django events.
## PLEASE IGNORE THE BREAK LINE IN THE FOLLOWING 2 LINES. THEY SHOULD BECOME A SINGLE ONE,
## SEPARATED BY A SPACE.$template LogglyFormatDjango, "<%pri%>%protocol-version% %timestamp:::date-rfc3339% %HOSTNAME%
%app-name% %procid% %msgid% [TOKEN@41058 tag=\"Django\"] %msg%\n"local7.* @@logs-01.loggly.com:514;LogglyFormatDjango
local7.* ~ #discards the messages so they don't end up in /var/log/syslogIn the above text, replace TOKEN with your customer token from the setup page. Then restart rsyslog to apply the changes.
sudo service rsyslog restartFinally, let’s edit Django settings.py file to add the logger:
LOGGING = {

   'version': 1,

   'disable_existing_loggers': False,

   'formatters': {

      'django': {

         'format':'django: %(message)s',

       },

    },


   'handlers': {

      'logging.handlers.SysLogHandler': {

         'level': 'DEBUG',

         'class': 'logging.handlers.SysLogHandler',

         'facility': 'local7',

         'formatter': 'django',

         'address' : '/dev/log',

       },

   },


   'loggers': {

      'loggly_logs':{

         'handlers': ['logging.handlers.SysLogHandler'],

         'propagate': True,

         'format':'django: %(message)s',

         'level': 'DEBUG',

       },

    }

}
To create a log event, add something like this to your code:
import logging

logger = logging.getLogger('loggly_logs')

logger.info('Hi, Welcome to Loggly.')
In the image below, you can see how Loggly shows you log records:
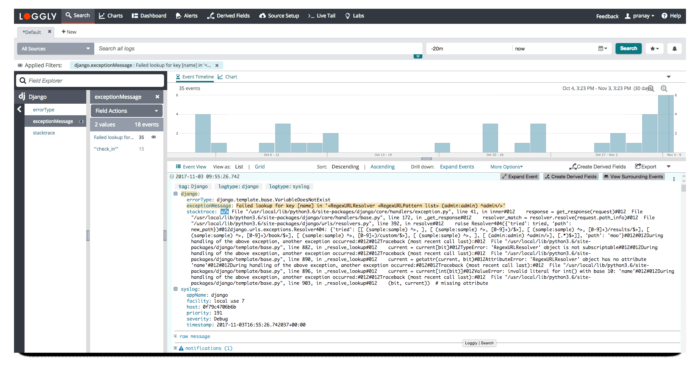
Loggly log (Source: Loggly)
From the image, I want to highlight the following log elements:
– django:
– errorType: the type of error
– exceptionMesage: the exception that created the error
– stacktrace: the error track
– syslog:
– appName: specific Django application
– host: server host name
– timestamp: when the error occurred
It’s important to see the information these elements provide because they allow you to locate the exact point where the error was raised.
In addition, Loggly searching and filtering features, including time intervals, saving you time in converting logs to a more usable format.
There’s also the option to define custom charts, so you can aggregate data and perform a deeper analysis.
How can we really take advantage of this logging facility?
First, you can put a few log calls:
– When you add a new user to the system
– On user login and logout, to determine session time
– In authentication errors and causes
– When the file monitor starts
– The moment a file is created in the network share, and the path to the file
– When a file is uploaded instead of saved in the network share
– When a file is added to the processing queue
– When you start processing a file
– When the file processing ends
– If there’s an error when processing a file
Then it’s time to execute the application and start logging events.
You can proactively look for specific error types, so when a user reports those error types, you’re already aware of them and looking for a solution. Or you can find the solution so fast that the end user isn’t aware there was a problem.
What happens if processing the file queue starts to take more time than usual? Start analyzing the entries, looking for the cause. Maybe there are more files than usual, or the hard disk is almost full, or it’s starting to fail.
In contrast, if there haven’t been messages about processing files, there can be two reasons. One is there are no new files. In that case, when was the last file noted? The other is the file monitor may be failing. If that’s true, when was the last time the monitor process started?
As a technical person, you probably have no issues reviewing log files or looking directly at syslog output. Still, I think it’s more efficient to view the information nicely formatted, with clearly differentiated sections. It’s also helpful to have the ability to filter and search through the log data without the hassle of having to transform the log files into another, more data-friendly format.
If you include additional sources, you’ll have all logs concentrated in a single place. It’ll be even easier to analyze data and spot errors, finding the error’s true root cause quickly and efficiently. Whether you’re working with Django logging or some other application, Loggly has a solution. Give Loggly a try!
This post was written by Juan Pablo Macias Gonzalez. Juan is a computer systems engineer with experience in back end, front end, databases, and systems administration.
Exploring further? You should check out the SolarWinds Apache Log Analyzer