Technical Resources
Educational Resources
APM Integrated Experience
Connect with Us
Node.js applications need significant maintenance to keep working as expected. Since Node.js applications are built on the V8 engine, it can be tricky to tune performance while keeping an eye on costs. This is why monitoring and measuring performance metrics and visualizing Node.js application performance is so crucial. Although you can track and observe numerous metrics, some metrics are more valuable when it comes to performance monitoring.
In this article, we’ll discuss what you should keep in mind when monitoring Node.js applications and look at some use cases. We’ll then look at top metrics for monitoring the performance of a Node.js application.
Monitoring is measuring and reporting on software quality over time, closely keeping track of an application’s performance and availability. If you have a Node.js application in a staging or production environment, it’s easier to do this type of monitoring using an application performance management (APM) solution. APM tools are essential for monitoring and optimizing an application’s performance.
In large-scale enterprise Node.js applications, scalability, flexibility, availability, and performance are crucial for running the application smoothly. Organizations are likely to lose customers if they can’t avoid downtime or if they provide poor application performance. As a result, it’s essential to continuously monitor performance metrics for critical applications.
The metrics an organization chooses to monitor are often related to the most crucial runtime problems encountered in the Node.js application.
To continuously monitor the performance of a Node.js application, you should measure and track core performance metrics for your Node.js application in production.
Some of the top metrics to look out for in a Node.js application are as follows:
Application programming interfaces (APIs) play a major role in transferring information to users on different user interfaces. Mistakes made on the UI of applications immediately affect the user; no customer appreciates unnecessary latencies or slow servers while using an application’s API. This is why it’s crucial to ensure the API performs as expected from the user’s standpoint. To achieve this, you should frequently monitor user-facing latencies to make sure the API is performing as expected.
To track an application’s user-facing latency performance, it’s critical to set a baseline. Consider any performance between two standard deviations from the baseline to be normal. Whether the Node.js performance is within or beyond the specified baseline will indicate if the API is performing as expected. Tracking user-facing latency is a good measure of whether the HTTP requests hitting your server get an immediate response, which is closely tied to the user’s experience on the application. Using the right monitoring tool, you can measure and track API response data, set a baseline, and analyze latency.
Because Node.js can process events asynchronously, it’s generally considered to be fast. This capability is a result of the event loop. An event loop is a construct of JavaScript designed to execute a block or tick of synchronous code outside of the main thread. When a response to a callback is received, Node.js picks up the block of code waiting in the queue and executes the event entirely before moving on to another one.
Because it’s non-blocking and single-threaded, Node.js can handle a vast number of connections. It can perform all your I/O operations using callbacks. An event loop can, however, sometimes slow down and ultimately cause every subsequent event to take longer to process. We call this an event loop lag.
Though Node.js is a non-blocking model, some events can cause event loop lag:
In this blocking model, Node.js can execute code blocks and other events simultaneously. It’s true this method of running code is fast and efficient, but it can impact the performance of requests in the event queue in the long run. It’s essential to monitor event-loop performance and identify transaction behavior likely to affect the application’s overall performance.
In a Node.js application, values are stored in two memory usage structures: stacks or heaps. Stacks keep temporary variables created by functions, which are then declared, stored, and initialized during runtime. On the other hand, heaps are more extensive and contain dynamically allocated memory. The maximum heap size in a Node.js application for a single process is 1.5GB.
This is why memory leaks are a common issue in Node.js applications. Memory leaks occur when the application code reserves a memory allocation in a heap and fails to free the memory even when it’s no longer needed. Failure to release the reserved memory causes a rise in memory usage, resulting in a spike in memory usage on the machine. Since Node.js is based on the V8 engine, it has a built-in garbage collector (GC) designed to manage the developer’s memory. The garbage collector is used to release the memory claimed by variables no longer needed.
If you notice memory usage for a process is increasing quickly and the garbage collection isn’t reducing usage periodically, you may be experiencing a memory leak. It’s challenging to track the root cause of a memory leak, so you’re often better off addressing it as soon as you notice a rise in memory usage rather than attempting to debug or troubleshoot it. Metrics to watch when monitoring memory usage include the following:
Measuring the layout of your application’s critical functions and connections is a necessity. The cloud has made applications extremely scalable and flexible, making it possible for the application topology to shrink and grow in response to user demands. Monitoring the application topology is a key factor to understand if the size of your environment is optimal. Having too many virtual server instances means your cloud-hosting cost will go up, and if you don’t have enough, your business transactions will suffer.
Application components frequently scale individually. Thus, you’ll likely analyze the performance of each application component while adjusting the topology accordingly. When accessing your application topology, watch out for the following metrics:
Node.js uses garbage collection to reclaim memory used by variables no longer needed. In a V8 runtime, garbage collection cycles stop program execution. As a result, they aren’t executed frequently. There are two types of garbage collection. The first, scavenging, uses incremental garbage collection cycles to process only a part of the heap at a time. The second is a full garbage collection cycle. This cycle reclaims memory from objects and variables that have escaped multiple incremental garbage collection cycles.
Frequently monitoring either or both garbage collection cycles reveals how much memory is retrieved and the time it takes to reclaim it. If you can, compare the size of the heap with the last released memory. This will help you determine if there’s a growing memory usage trend indicating a memory leak.
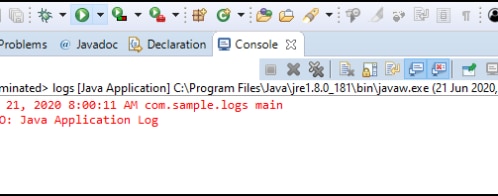
An excellent tool for monitoring your application is SolarWinds® Loggly®, which you can use to monitor Node.js logs and identify and troubleshoot application issues. The integration of SolarWinds AppOptics™ and SolarWinds Loggly has created a powerful APM tool built to accelerate the identification of application and infrastructure performance problems by combining metrics, traces, and log monitoring. For example, with Loggly, you can evaluate application and service metrics in minutes; quickly pinpoint latency, errors, and spikes; and more. The integration with AppOptics goes one step further, allowing you to drill down into application and infrastructure performance with preconfigured and custom metrics. To learn more, watch this quick video about how these two products come together to simplify application performance monitoring.
In every Node.js application, choosing metrics to monitor depends on the results expected at the end of the analysis. Thus, continuously monitoring performance metrics in Node.js is an effective way to identify minor issues capable of growing into potential problems.
In this article, we discussed how measuring Node.js metrics is essential in maintaining an application’s health and performance. We also highlighted top metrics you should track in a Node.js application and how monitoring these metrics can help provide the best user experience. Using the correct monitoring tools will help you identify problems and understand the root cause of issues. In short, Loggly and AppOptics are the perfect tools to monitor and analyze performance metrics for applications and infrastructure.
This post was written by Anita Ihuman. Anita is a software developer with experience working with React (Next.js, Gatsby) and in the web development industry. She has proficient skills in technical blogging and public speaking, and she enjoys exchanging information. She loves contributing to open-source projects. Anita is community manager at layer5, creates blog posts for the community blog, and is a content creator for the Gnome Africa Blog.
Didn’t find what you were after? Consider the SolarWinds Node.js performance monitoring