Technical Resources
Educational Resources
APM Integrated Experience
Connect with Us
Robust logging and log management is a nonnegotiable requirement in any serious system. If you operate applications in production or during the dev environment, you need information about what’s happening collected at scale. You also need to gather the logs generated by all your applications.
Collecting logs isn’t enough. Previously, we used to connect to servers one by one to check the logs. In a world where a system spans a plethora of hosts, this approach doesn’t work. The developers in your organization need the best tools to analyze the behavior of their applications and spot problems.
In this post, I’m presenting the ELK stack, a collection of tools used for log processing.
A cloud-native application generates tons of logs. Tailing files manually through SSH is nothing less than barbaric these days. A professional logging solution has to bring a basic set of features:
Each concern is fairly complex on its own. It’s no wonder bespoke tools exist for each scenario.
Before we move on to ELK itself, let’s talk about logs. According to the 12 Factor App, you should treat logs as event streams. What does this mean?
Your applications shouldn’t be responsible for log files. Instead, they treat log events as a stream that they write, unbuffered, to standard output. Nowadays, structured JSON output is the norm to ensure maximum compatibility.
The execution environment is responsible for capturing, collating, and archiving these logs. The process for routing log data remains separated from the processing of it.
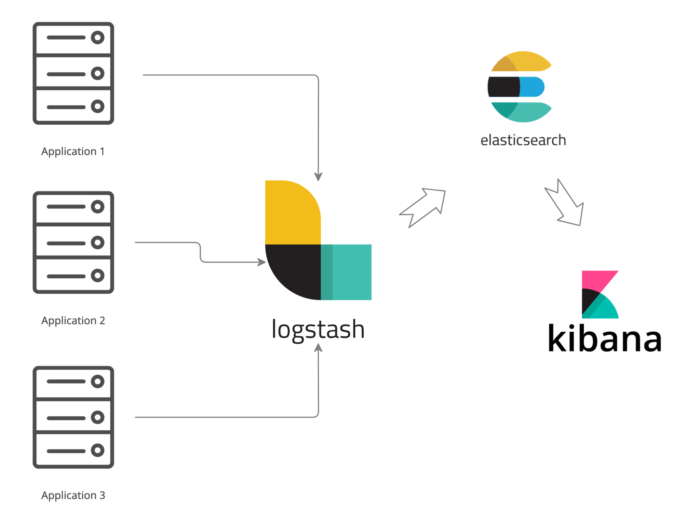
ELK describes a stack of three popular open-source projects used together as a logging solution:
Let’s talk about them one by one.
Elasticsearch is a search engine built on top of Apache Lucene. It’s built on top of the JVM and can ingest vast amounts of data. It provides rich search capabilities. You can do free text search over all fields on the document. Additionally, you can do more structured queries, where you combine search operators limited to specific fields in whatever way you like. Some categorize it as a NoSQL database.
While Elasticsearch is a complex beast, two elements in its design are relevant for us:
Typically, you interact with it through its comprehensive API. A sample query looks like this:
GET /_search
{
  "query": {
    "query_string": {
      "fields": [
        "title",
        "content"
      ],
      "query": "this OR that OR thus",
      "type": "cross_fields",
      "minimum_should_match": 2
    }
  }
}
Initially, Elasticsearch started as a way to provide search in applications. Why is this relevant for log processing? If you’re ingesting huge numbers of logs, you won’t get any insights without a powerful search tool. A tool specialized in finding text across many documents (in our case, log entries) is exactly what the doctor ordered for this situation.
Logstash ingests logs from multiple sources. It collects logs, transforms them, and then sends them to the desired location.
Logstash has a rich plugin ecosystem to enhance its capabilities, like adding more inputs, outputs, or new transformations. You configure it with a DSL like this:
apache.conf
input {
  file {
    path => "/tmp/*_log"
  }
}

filter {
  if [path] =~ "access" {
    mutate { replace => { type => "apache_access" } }
    grok {
      match => { "message" => "%{COMBINEDAPACHELOG}" }
    }
    date {
      match => [ "timestamp" , "dd/MMM/yyyy:HH:mm:ss Z" ]
    }
  } else if [path] =~ "error" {
    mutate { replace => { type => "apache_error" } }
  } else {
    mutate { replace => { type => "random_logs" } }
  }
}

output {
  elasticsearch { hosts => ["localhost:9200"] }
  stdout { codec => rubydebug }
}
Logstash has a drawback: it consumes a lot of resources. This is especially apparent once you manage many nodes. For this reason, Elastic Beats is the newest addition to the ELK stack. Beats are simple data shippers with a small footprint intended to run at the edge of your ecosystem. They alleviate the resource consumption issue.
In this alternate setup, Elastic Beats functions as a lightweight data collector you use as a leaf collector. It runs on every node you want to monitor. Meanwhile, you require fewer Logstash nodes processing logs before shipping them to Elasticsearch.
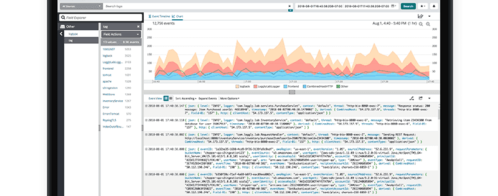
Kibana is the visual layer on top of Elasticsearch. As mentioned, Elasticsearch is heavily API-based. Kibana helps developers with two tasks: exploring logs and building visualizations.
Exploring logs usually starts with a developer trying to figure out a problem and searching through logs. For instance, if you look at the screenshot below, you can see the developer might be interested in finding all the redirects occurring in the application. Filtering by field, grouping the results, or controlling the time range for the query are other options. Kibana provides a graphical interface to do all this conveniently.

The second important aspect of Kibana relates to visualization. Building dashboards out of crucial metrics is very helpful because it distills the information into something visual and consumable by anybody in the organization, not just the person who initially created it.
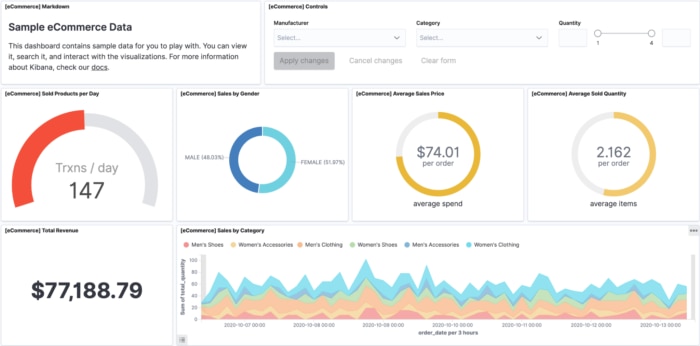
In summary, Kibana makes the data you painstakingly collect accessible.
ELK is a proven solution to cover your logging needs, but is it worth it to expend the effort in operating it?
Operating ELK at scale is no picnic. Elasticsearch alone requires quite a bit of tuning. I’ve worked in digital transformation projects where half the cloud costs were related to the logging infrastructure. And that doesn’t account for the people operating it. It takes expertise and time to keep it running. This is time you aren’t investing in your core business needs.
SolarWinds® Loggly® gives you an integrated, purpose-built log management solution with batteries included. In practice, it’s hard to find the time to dedicate to a non-core part of your business that can lag in features, updates, and general reliability. Instead, letting a dedicated SaaS tool handle it for you is the best decision for many organizations.
Loggly offers automated parsing of many types of logs, which is often a time sink when setting up Elasticsearch. You can extend this with custom logic using derived fields. The automated parsing works well together with the Dynamic Field Explorer™ to make it easy and fast to find what you’re looking for.

To summarize, the ELK stack provides a logging solution based on three components: Elasticsearch (log analysis), Logstash (log collection and processing), and Kibana (visualization).
You can’t ship production software without good logging during the development process and while in production. Logging isn’t optional. If you find yourself overwhelmed by the complexity of the topic, Loggly is a simple-to-implement hosted alternative to the ELK stack, with many useful features to make your life easier.
This post was written by Mario Fernandez. Mario develops software for a living—then he goes home and continues thinking about software because he just can’t get enough. He’s passionate about tools and practices, such as continuous delivery. And, he’s been involved in front-end, back-end, and infrastructure projects.
Exploring further? You should check out the SolarWinds Log Analyzer