Technical Resources
Educational Resources
APM Integrated Experience
Connect with Us
Setting up logging is often overlooked when developers build applications. However, logs provide meaningful information to help you understand what’s happening in your application—and more importantly, they can help you troubleshoot problems. Additionally, you can use logging data to track various metrics related to your application. For example, logs can easily track the availability of your service or the number of errors occurring within a given time frame. This last one is an important indicator for assessing the health of your application.
This article guides you through some different options for JavaScript logging. But first, let’s look at what you should log.

You must decide what information to log so you don’t log meaningless data. Focus on important actions, such as handling API requests and transmitting events.
It’s not useful to log information describing the internal actions of a function because developers can understand what the code does by reading the documentation and code itself. There’s also no need to describe what your code does through logging functions. For example, if you log the text “calling function X,” this doesn’t add any meaningful information.
The packages we’ll mention later commonly use most of the elements listed below in their log formats.
1. Timestamp: This is crucial for understanding the timing of events
2. Computer Name: This is important for identifying which machine handled a request, especially when you run a distributed system
3. Process ID: This is useful information for when you run multiple node processes
4. Message: This is an informational message you want to log
5. Stack Trace: This is extra information about the flow of your code
You aren’t limited to the above list when logging data. You can also log additional information—such as variables—to make it easier to troubleshoot a problem.
Now you understand which information to log, so let’s explore log levels and look at some common log levels for JavaScript.
Log levels are categories designed to tell you how urgent each entry in the log file is. There’s no standard for log levels in JavaScript, but these are the four most common logging levels from most to least urgent:
1. Error: A serious issue occurred in your application and requires attention—for example, this might be a dropped database connection or an inaccessible file.
2. Warning: The warning level lays in a gray area of logging levels. You can use a warning level to indicate the detection of an unusual situation with the potential to cause an error. However, the detected situation hasn’t caused any harm yet (and may not ever cause harm). These are useful to look at over time, as they can become a metric you can view proactively to prevent more serious errors.
3. Info: Most commonly, you use the info log level to display important application actions, such as the successful completion of an API request or data successfully being written to an output file. You can use the info log level like a thread through your application to tell you the most important actions that have occurred.
4. Debug: Use the debug log level to print diagnostic information capable of helping you troubleshoot an application. For example, a log can print the contents of an important variable or display the state of your application. This kind of information is vital if you want to understand what happened in your application when you encounter an error message.
There’s also the well-known console.log statement for JavaScript, which prints data as plaintext. We’ll talk more about this later.
Every JavaScript developer knows about the console object. Most developers love to use the log function of the console object to quickly print the contents of a variable to the terminal. The console.log function has no associated log level; it simply prints data to the terminal as text. A developer often uses the console.log function to quickly validate whether their code works or whether a variable contains the correct content.
The console.error function is a popular function for logging error messages, and there’s a big difference between the console.log and console.error functions.
By default, every process has three streams: stdin, stdout, and stderr. Stdin accepts text input, whereas stdout delivers text output from your application to the shell. Your system uses stderr solely to send error output from your app to your shell. In other words, stdout can deliver any text, whereas stderr can deliver only text for errors. Both send output from the app to the shell.
An important difference between console.log and console.error is the console.log function writes to stdout and the console.error function writes to stderr.
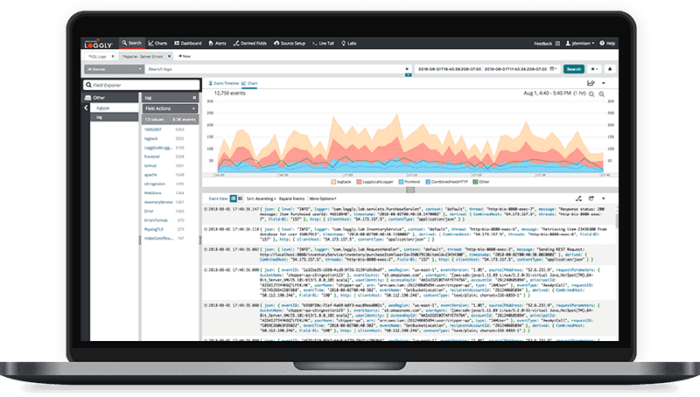
Why is this important? Having these different streams for your application allows you to pipe error messages to an error file to store them persistently—you might be less interested in messages coming from stdout. This also opens up the opportunity to pipe log data to a third-party platform like SolarWinds® Loggly® to parse and analyze the data. For example, Loggly offers the loggly-jslogger package to pipe log data from your JavaScript application.
The console.time function allows developers to time the execution of a code block. You can pass a single argument to the console.time function to set the timer’s name. We have to name timers because we can run several timers concurrently. To stop the correct timer, you need to use the unique name of each timer.
console.time("myFirstTimer")

// code block to time

for (i = 0; i < 10; i++) {

    // some business logic code

}

console.timeEnd("myFirstTimer")
To stop the timer when the code block has finished execution, you call console.timeEnd. When you stop the timer, it’ll print the time elapsed since the timer started in seconds.
The console.dir function displays an interactive list of properties for a given JavaScript object. Instead of using console.log, which prints the whole object as a string, you can interactively explore and open specific properties for an object using console.dir.
Here’s a short example demonstrating the difference between console.log and console.dir when you want to print an object, such as an array of numbers:
> console.log([1, 2])

[1, 2]

> console.dir([1, 2])

* Array[2]

    0: 1

    1: 2

    length: 2

    * __proto__: Array[0]

        concat: function concat() { [native code] }

        constructor: function Array() { [native code] }

        entries: function entries() { [native code] }

...Lastly, console.trace outputs a stack trace to your console. A stack trace contains all previous function calls leading up to the point when you used console.trace to log the stack trace. Here’s an example of a snippet of code calling the console.trace function:
function multiply(x, y) {

    console.trace('multiply function called with', x, 'and', y);

    return (x*y);

}

function init() {

    const result = multiply(1, 4)

}

init();

/**

 * Resulting stack trace:

 * "multiply function called with 1 and 4"

 * multiply (@line 2)

 * init (@line 7)

 * (anonymous function) (@line 10)

 */
As you can see, the code snippet first calls the init function before calling the multiply function from the init function. Within the multiply function, we call the console.trace function to log the stack trace.
Moreover, logging the arguments that called functions allows developers to use a stack trace to quickly understand the flow of the code and the arguments it used.
Next, let’s discuss popular JavaScript logging packages you can use for your project. Here are a few of these logging packages:
– Winston: Winston is a popular logging library allowing you to configure multiple transports. For example, you can store error logs persistently in a remote location and print all warning and info logs to your console. Winston is a versatile logger you can easily configure.
– Pino: Pino focuses on using as few resources as possible for logging. Log messages can create a throttling effect on applications over time—like reducing the response ratio—and Pino will reduce this throttling.
– Bunyan: Bunyan offers the ability to configure multiple transport streams and even supports log file rotation. Furthermore, Bunyan offers a command line interface (CLI) tool designed to allow you to pretty-print and filter Bunyan logs.
And there you have it—a simple explanation of JavaScript logging. This article discussed the capabilities of the console object and touched on popular JavaScript logging packages and the anatomy of logs.
JavaScript logging makes it easier to troubleshoot your application. Logging provides you with valuable insights about what went wrong to help speed up the resolution time for a problem.
Loggly provides different log transport packages you can use to transport logs to Loggly for storage or analysis purposes. Want to try out Loggly for free? You can sign up here.
This post was written by Michiel Mulders. Michiel is a passionate blockchain developer who loves writing technical content. Besides this, he loves learning about marketing, UX psychology, and entrepreneurship. When he’s not writing, he’s probably enjoying a Belgian beer.
Looking to expand your options? Try the SolarWinds Log Visualization