Why Transaction Tracing is Critical for Monitoring Microservices

Teams switching from a monolithic application architecture to microservices often face a jarring realization: their time-tested troubleshooting techniques don’t work as effectively. A microservice consists of many independent, distributed, and ephemeral services with varying capabilities for monitoring and logging. Techniques such as stack traces are effective troubleshooting tools in monoliths, but only paint a small portion of the big picture in a microservice-based application.
In order to fully understand how applications are performing and behaving, teams need ways to correlate multiple isolated events across different services as a single transaction. This is known as transaction tracing. In this blog post, we’ll explain why it’s so important for monitoring microservices.
What is Transaction Tracing, and Why is it Important?
Transaction tracing is the process of tracking an event—such as a request from a user—throughout an application. You can do this by generating a unique identifier at the application entry-point upon receiving requests, then propagating this ID to each subsequent service along with the request itself. Microservices benefit significantly from transaction tracing due to their loosely coupled nature. By appending this unique ID to logs and traces, teams can enrich their debugging data with detailed messages, stack traces, and metrics for each request.
In addition to showing the path of requests, tracing helps with application performance monitoring (APM) by tracking the response time of each service. The unique IDs are plain text strings that can be easily appended to log messages to link error messages, stack traces, and other debugging data to requests.
Example: Tracing a Web Application Issue
As an example, consider a web application for booking hotel rooms. Depending on the user’s actions, requests come into the public-facing web-tier service and pass through to one of many back-end services. The application deploys over Kubernetes and SolarWinds® AppOptics™ monitors it.
In this case, numerous requests to the booking-service back end were redirected, and we want to find out why. Let’s start by opening AppOptics and viewing the booking service. We’ll pick a trace that was recently redirected by opening the Traced Requests tab. Here, we can see a full breakdown of the trace with the amount of time spent in each span.
Scrolling down, we can see errors in the faraday, java, and spring spans.
This is helpful, but it doesn’t tell us what happened exactly. Clicking on the error provides more detail, but not enough to truly determine the cause. Next, let’s view the service’s logs to find a clearer answer.
Logs to the Rescue
AppOptics integrates with SolarWinds Loggly®, a hosted log management service that can readily ingest, index, and analyze any kind of log, including Kubernetes logs. Once integrated, AppOptics automatically logs each trace with a unique trace ID. Being able to find the logs for a given transaction is not a standard feature in most logging solutions; you get this power only when using an APM solution like AppOptics which can automatically link the two together.
Finding logs for a given trace is as easy as clicking the “Search Logs” button above the trace breakdown, or by searching on the trace ID in Loggly. From here, it only takes a second to find the exact stack trace we need.
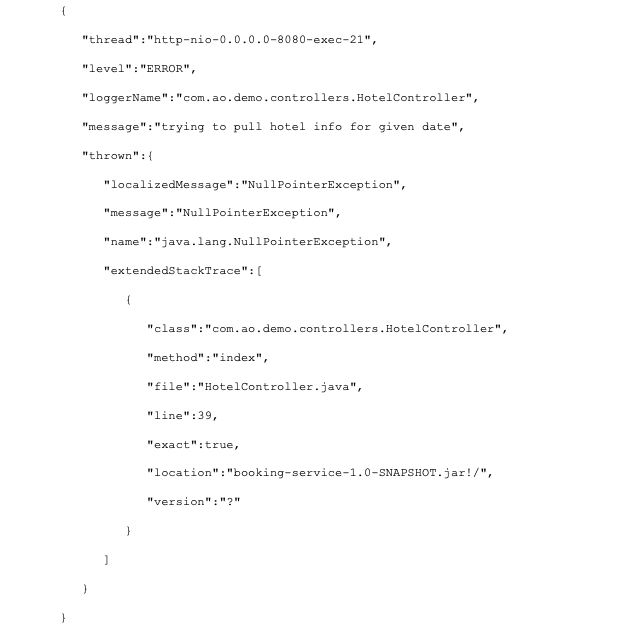
In our example, a request to the HotelController caused a NullPointerException at line 39 in HotelController.java:
If we want to know which parameters triggered the request, we can scroll to the event immediately preceding this one. Here, we see the full request and parameters that triggered the error, making it easier for a developer or QA analyst to troubleshoot or reproduce the issue.
APM and Logs: Working Together to Monitor Microservices
APM tools like AppOptics are powerful monitoring tools on their own, but pairing them with logging tools like Loggly provides much deeper visibility. In our example, we were only able to get to the root of our problem by digging into both APM traces and log data.
AppOptics and Loggly automate most of the hard work in monitoring and tracing microservices. Integrating both solutions offers the best of both worlds: the traceability and performance monitoring of APM, and the comprehensive detail of log data. To learn more about AppOptics and Loggly, visit the Loggly blog or sign up for free trials at appoptics.com and loggly.com.
The Loggly and SolarWinds trademarks, service marks, and logos are the exclusive property of SolarWinds Worldwide, LLC or its affiliates. All other trademarks are the property of their respective owners.

Andre Newman