Technical Resources
Educational Resources
APM Integrated Experience
Connect with Us
Who doesn’t want their application to be better and faster than the others? A better application can be good for both your reputation and business. Understanding your application is the first step to enhancing your application. There are different ways of understanding your app, one of them being to monitor the application logs. Monitoring logs gives you a clear picture of how your application is working, which in turn helps you understand how to make it better.
In this blog, I’ll introduce you to Java application logs and explain how to generate them. Then I’ll explain how you can monitor these logs better with SolarWinds® Loggly®, to ensure you deliver a better application experience for your customers.
Before talking about how to generate and use logs, let’s discuss what they are and why you need them.
Logs are pieces of information regarding the status of an application. When you write a Java code or build an application using Java, many things happen when the code executes. The person using the application sees only what the user interface allows him or her to see. But there’s far more to what happens than that. Java application logs are full of data the application generates as part of its operation. This data helps you understand the execution of the application and its behavior.
What kind of information logs contain depends on how the developer has programmed the application. You can generate logs to display critical situations, notify errors, keep track of the status of the application, and so on. But why do you need all this?
Let’s say you have a Java application automating certain actions on Facebook. It could be an app allowing you to post a message or image on users’ Facebook walls when they log in. In this case, the user of your application can see a dialog box to enter his or her password. Then the user can enter the text they want to post on their wall or choose an image to upload. Once the user enters all this information, the application starts doing its job. The application will use the input the user gives to log in to Facebook. Then it’ll post the text or image selected onto the user’s wall.
The first step is to log in. The login can succeed or fail. There can be many reasons for login failure, such as wrong credentials, internet issues, and code execution failure. It’s important to understand why it failed, so you can fix the issue (if it’s fixable at your end). In such cases, logs would help you understand the scenario better. You need logs to understand the application’s behavior.
Application logs not only help you identify issues, but they also help you understand the status of your application. To understand logs a little more clearly, let’s look at the types of logs in Java.
We can put Java application logs into three main categories.
– Errors and Warnings: These logs show any issues in the code of the application, either through static analysis or dynamic analysis. They give you a high-level understanding of the situation.
– Application Server Logs: If your application is based on a client-server model, you have a server to handle certain tasks of your application. Server logs help you understand any issue on the server side of the application.
– System Logs: These are the logs the operating system generates when your application executes. Such logs help you understand and improve your application performance.
Now that you understand the basics of Java application logs, let’s look at an example of how to generate logs in Java.
You can generate logs in your Java application by using the logging utility. Here’s a simple Java example generating a log:
import java.io.IOException;

import java.util.logging.Level;

import java.util.logging.Logger;


public class logs {


private static final Logger LOGGER = Logger.getLogger(logs.class.getName());

public static void main(String[] args) {

// TODO Auto-generated method stub


LOGGER.log(Level.INFO, “Java Application Log”);


}

}
When I execute this, I see the log it generates.
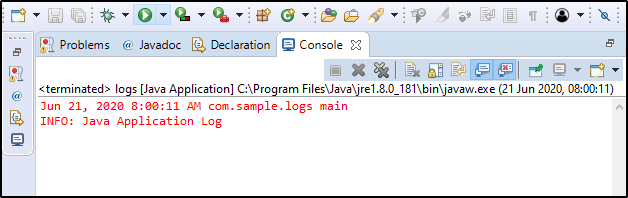
That’s how simple generating logs is. Based on what your application does, you can generate logs at different points in your application.
Now let’s see what help you can get when it comes to log monitoring.
Before talking about Loggly in particular, let’s explore why you need a log monitoring tool in the first place.
Log monitoring tools help you centralize all log-related tasks. From collecting logs to organizing and visualizing data, these tools help make your work with logs simple. It’s important to take care of the security of your application, and log monitoring tools help you achieve this.
By using a log monitoring tool, you don’t have to invest extra resources in handling logs or building a system to do it for you. You only need to train your team on how to use the tool. This helps you run your business smoothly, so you can focus on more important things.
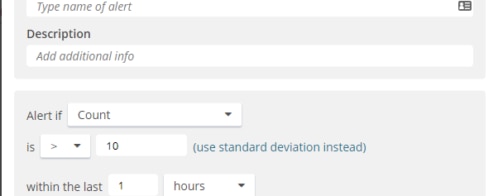
Log monitor tools work in real time. Whenever there’s a critical issue, they’ll notify you immediately. This helps you take quick actions in case of any incident.
Also, you can access most of these tools remotely. This means you don’t have to be at your workplace or carry your work laptop around all the time. Instead, you can log in to these tools remotely from wherever, whenever you want, and still be able to look at the logs and monitor them.
Many log monitoring tools also provide analytics. These help you understand your complete application. Looking at hundreds or thousands of lines of logs can get messy. And when you have such a large number of logs, making sense of them becomes difficult. Analytics helps you convert raw logs into meaningful data in an easier way.
Okay, we’ve talked about Java log monitoring in general. What’s special about Loggly in particular?
Loggly provides all the features mentioned in the above section. You get real-time proactive monitoring, useful data analytics, and optimization. Along with this, Loggly helps you troubleshoot by finding the root cause for each issue. You’ll be able to see how different components of your application interact with one another, which will help you identify the correlations.
Collaboration is an important part of development, and the team at Loggly knows it. They’ve provided support for integrating with collaboration tools such as Slack, Jira, and others.
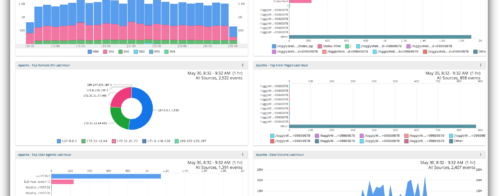
Loggly also provides a preconfigured dashboard for Java applications (among others). This helps you analyze your application and its performance in a few clicks.
To start using Loggly, log in or sign up and set up your account. This process will create a subdomain for you to transfer your application logs to Loggly.
You’ll find various ways of sending logs to Loggly, such as using Log4j 1, Log4j 2, HTTP/S, and syslog. Once you set up Loggly using your preferred method, log monitoring becomes easy.
Application log monitoring helps you succeed and be efficient. Logs are messy, and there’s always an effort to make log monitoring and management easier. But your developers’ bandwidth is tied up in building the application, so there’s not much time to build a system for log monitoring. Why invest those resources somewhere you don’t need to?
In such cases, log monitoring tools are essential. SolarWinds Loggly makes the process of log monitoring and management easy, and it has a wealth of features. Try Loggly for monitoring your Java application logs, and see for yourself how useful it is. You can get a free trial for Loggly here.
This post was written by Omkar Hiremath. Omkar uses his BE in computer science to share theoretical and demo-based learning on various areas of technology, like ethical hacking, Python, blockchain, and Hadoop.
Exploring further? You should check out the SolarWinds Observability SaaS