Technical Resources
Educational Resources
APM Integrated Experience
Connect with Us
There’s a great deal of information stored within your Linux logs, but the challenge is knowing how to extract it. There are several tools you can use to do this, from command-line tools to more advanced analytics tools capable of searching specific fields, calculating summaries, generating charts, and much more.
In this section, we’ll show you how to use some of these tools and how log management solutions like SolarWinds® Loggly® can help automate and streamline the log analysis process.
One of the simplest ways to analyze logs is by performing plain text searches using grep. grep is a command line tool capable of searching for matching text in a file or output from other commands. It’s included by default in most Linux distributions and is also available for Windows and macOS.
To perform a simple search, enter your search string followed by the file you want to search. Here, we search the authentication log for lines containing “user hoover”:
$ grep "user hoover" /var/log/auth.log
pam_unix(sshd:session): session opened for user hoover by (uid=0)
pam_unix(sshd:session): session closed for user hoover
Note this returns lines containing the exact match. This makes it useful for searches where you know exactly what you’re looking for.
A regular expression (or regex) is a syntax for finding certain text patterns within a file. Regular expressions are much more flexible than plain text searches because they let you use several techniques beyond simple string matching. They allow for a high degree of control, but constructing an accurate pattern can be difficult.
For example, let’s say we want to find authentication attempts on port 4792. Simply searching “4792” would match the port, but it could also match a timestamp, URL, or another number. In this case, it matched an Apache log that happened to have 4792 in the URL:
$ grep "4792" /var/log/auth.log
Accepted password for hoover from 10.0.2.2 port 4792 ssh2
74.91.21.46 - - [06/Jun/2019:19:44:32 +0000] "GET /scripts/samples/search?q=4792HTTP/1.1" 404 545 "-" "-"
To prevent this, we could use a regex only returning instances of 4792 preceded by “port” and an empty space. We do this using a technique known as positive lookbehind. Our expression looks like this (the -P flag indicates we’re using the Perl regular expression syntax):
$ grep -P "(?<=port\s)4792" /var/log/auth.log
Accepted password for hoover from 10.0.2.2 port 4792 ssh2
Using surround search returns several lines before or after a match. This provides context for each event by letting you trace the events leading up to or immediately following the event. The -B flag specifies how many lines to return before the event, and the -A flag specifies the number of lines after.
For example, let’s search for attempted logins with an invalid username and show the surrounding results. We see users who fail to log in also fail the reverse mapping check. This means the client doesn’t have a valid reverse DNS record, which is common with public Internet connections. This doesn’t mean your SSH server is vulnerable, but it could mean attackers are actively trying to gain access to it.
$ grep -B 3 -A 2 'Invalid user' /var/log/auth.log
Apr 28 17:06:20 ip-172-31-11-241 sshd[12545]: reverse mapping checking getaddrinfo for 216-19-2-8.commspeed.net [216.19.2.8] failed - POSSIBLE BREAK-IN ATTEMPT!
Apr 28 17:06:20 ip-172-31-11-241 sshd[12545]: Received disconnect from 216.19.2.8: 11: Bye Bye [preauth]
Apr 28 17:06:20 ip-172-31-11-241 sshd[12547]: Invalid user admin from 216.19.2.8
Apr 28 17:06:20 ip-172-31-11-241 sshd[12547]: input_userauth_request: invalid user admin [preauth]
Apr 28 17:06:20 ip-172-31-11-241 sshd[12547]: Received disconnect from 216.19.2.8: 11: Bye Bye [preauth]
Tail is another command line tool capable of displaying the latest changes from a file in real time. This is useful for monitoring ongoing processes, such as restarting a service or testing a code change.
You can also use tail to print the last N lines of a file using tail -n:
$ tail -n 5 /var/log/messages
Nov 11 23:15:40 rockyLinuxPepperAndEgg DropletAgent[729407]: INFO:2022/11/11 23:15:40 creds_actioner.go:49: [Creds Actioner] Attempting to update 1 dotty keys
Nov 11 23:15:40 rockyLinuxPepperAndEgg DropletAgent[729407]: INFO:2022/11/11 23:15:40 creds_actioner.go:70: [Creds Actioner] Updating 1 keys
Nov 11 23:15:40 rockyLinuxPepperAndEgg DropletAgent[729407]: INFO:2022/11/11 23:15:40 creds_actioner.go:75: [Creds Actioner] Keys updated
Nov 11 23:15:41 rockyLinuxPepperAndEgg systemd[1]: Started Session 4 of user root.
Nov 11 23:15:41 rockyLinuxPepperAndEgg systemd-logind[790]: New session 4 of user root.
Additionally, the output of tail -f can be piped into grep to filter the output from a log file.
$ tail -f /var/log/auth.log | grep 'Invalid user'
Apr 30 19:49:48 ip-172-31-11-241 sshd[6512]: Invalid user ubnt from 219.140.64.136
Apr 30 19:49:49 ip-172-31-11-241 sshd[6514]: Invalid user admin from 219.140.64.136
If you pipe tail -f into grep and experience significant delays, appending --line-buffered to grep may help. For example, our previous command would become the following:
$ tail -f /var/log/auth.log | grep --line-buffered 'Invalid user'
A full introduction to grep and regular expressions is outside the scope of this guide, but you can find more resources at the end of this section.
The cut command allows you to parse fields from delimited logs. Delimiters are characters like equal signs or commas that break up fields or key-value pairs.
Let’s say we want to parse the user from this log:
pam_unix(su:auth): authentication failure; logname=hoover uid=1000 euid=0 tty=/dev/pts/0 ruser=hoover rhost= user=root
We can use the cut command to get the eighth match. This example is on an Ubuntu system:
$ grep "authentication failure" /var/log/auth.log | cut -d '=' -f 8
root
Filtering allows you to search on a specific field value instead of doing a full text search. This makes your log analysis more accurate because it will ignore undesired matches from other parts of the log message. To search on a field value, you need to parse your logs or at least have a way of searching based on the event structure. To do this, we can use awk.
Awk is a powerful command-line tool providing a complete scripting language, so you can filter and parse out fields more effectively. For example, let’s say we want to extract the username from all failed login attempts. Our logs have the following format:
Mar 24 08:28:18 ip-172-31-11-241 sshd[32701]: input_userauth_request: invalid user guest [preauth]
Here’s how you can use the awk command. First, we’ll use the regular expression /sshd.*invalid user/ to match the sshd invalid user lines. Then, we’ll print the ninth field using the default delimiter (a space character) using { print $9 }. This outputs the usernames.
$ awk '/sshd.*invalid user/ { print $9 }' /var/log/auth.log
guest
One of the most common things people want to see in their logs are errors. Unfortunately, the default syslog configuration doesn’t output the severity of errors directly, making it difficult to filter on them.
There are two ways you can solve this problem. First, you can modify your rsyslog configuration to output the severity in the log file to make it easier to read and search. In your rsyslog configuration, you can add a template with pri-text:
"<%pri-text%> : %timegenerated%,%HOSTNAME%,%syslogtag%,%msg%n"
This example gives you an output in the following format. You can see the severity in this message is “err”:
<authpriv.err> : Mar 11 18:18:00,hoover-VirtualBox,su[5026]:, pam_authenticate: Authentication failure
You can use awk to search for just the error messages. In this example, we’re including some surrounding syntax to match this field specifically:
$ awk '/.err>/ {print}' /var/log/auth.log
<authpriv.err> : Mar 11 18:18:00,hoover-VirtualBox,su[5026]:, pam_authenticate: Authentication failure
Though command-line tools are useful for quick searches on small files, they don’t scale well for large files or across multiple systems. Log management systems are much more effective at searching through large volumes of log data quickly. We’ll discuss log management systems in the next section.
Log management systems help simplify the process of analyzing and searching large collections of log files. They can automatically parse common log formats like syslog events, SSH logs, and web server logs. For example, SolarWinds Papertrail supports a live tail for all logs in a single consolidated view.
Log management systems can also index each field so you can quickly search through gigabytes or even terabytes of log data. They often use query languages like Apache Lucene to provide more flexible searches than grep with an easier search syntax than regex. This can save both time and effort since you don’t have to create your own parsing logic for each unique search.
For example, here we’re collecting logs from a Debian server using Loggly, a cloud-based log management service. Here’s an example log message from sshd, which automatically parses out the user field:
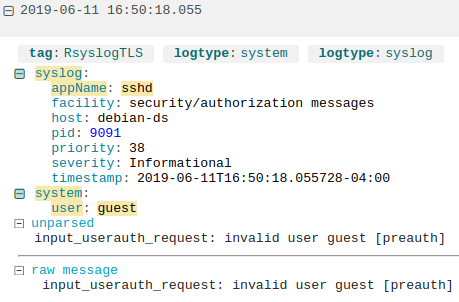
A failed login attempt parsed by Loggly.
You can also do custom parsing for nonstandard formats. Using derived fields, we can parse the unparsed portion of the message by defining its layout. This lets us index each individual field in the unparsed data instead of treating it as a single string. For example, we can create a new field called “auth_stage” and use it to store the stage in the authentication process where the error occurred, which in this example is “preauth”:
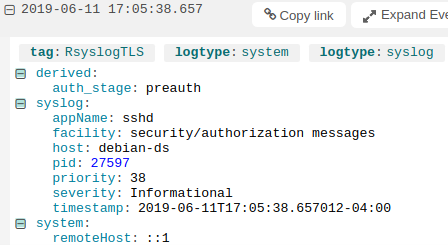
Viewing a derived field in the Loggly Dynamic Field Explorer™.
Log management systems can make it easier to filter on errors since they automatically parse logs for us. In many cases, you can simply click on the desired field and enter a value to filter the resulting logs. For example, we can view errors in Loggly by clicking on the syslog severity field and selecting “Error”:
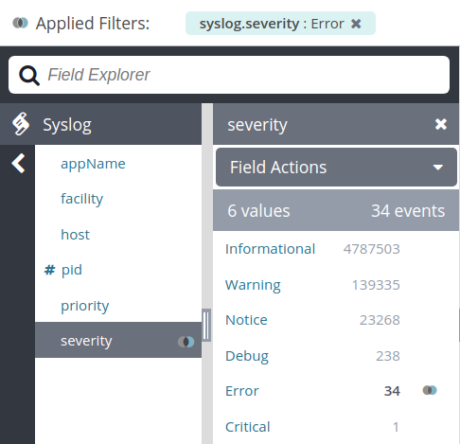
Filtering on syslog messages with severity “Error” in SolarWinds Loggly.
Grep and Regular Expressions! (Ryan’s Tutorials)
The GNU Awk User’s Guide (GNU)
Using Grep & Regular Expressions to Search for Text Patterns in Linux (DigitalOcean)
Last updated: 2022
On the hunt for more? Don’t forget to visit the SolarWinds Ubuntu System Monitoring