Technical Resources
Educational Resources
APM Integrated Experience
Connect with Us
The Apache log records events handled by the Apache web server, including requests from other computers, responses sent by Apache, and actions internal to the Apache server. This section of the guide explains the basics of Apache logging, including the types of logs generated by Apache, where they’re stored, and how to interpret them. We’ll also cover advanced topics such as setting custom log formats and configuring modules to get richer data.
Apache generates two kinds of logs: access logs and error logs.
The access log contains information about requests coming into the web server. This information can include what pages people are viewing, the success status of requests, and how long the server took to respond. Here’s an example of a typical access log entry:
10.185.248.71 - - [09/Jan/2015:19:12:06 +0000] 808840 "GET /inventoryService/inventory/purchaseItem?userId=20253471&itemId=23434300 HTTP/1.1" 500 17 "-" "Apache-HttpClient/4.2.6 (java 1.5)"
The error log contains information about errors the web server encountered when processing requests, such as missing files. It also includes diagnostic information about the server itself. Here’s an example error log:
[Thu Mar 13 19:04:13 2014] [error] [client 50.0.134.125] File does not exist: /var/www/favicon.ico
By default, Apache stores access and error logs in separate files on the server. The exact location depends on your operating system. You can find the location for your OS by clicking on the following links:
These link to sections lower down in this document. They will need to be relinked appropriately when uploaded to CMS.
Apache has a highly configurable logging framework built to let you adjust logging behavior globally or for each virtual host. There are several directives you can use to change logging behavior. Some of the more common directives are the log level and log format directives, which we’ll explain in greater detail.
The LogLevel directive determines the minimum severity level of events logged to a specific destination. The severity level represents how important the event is and can range from “Emerg” to “Trace8,” with “Emerg” representing events potentially leading to instability and “Trace8” representing trace-level messages. For example, LogLevel crit will allow logs with “Crit,” “Alert,” and “Emerg,” severity through but will ignore all other levels.
The LogFormat directive controls the layout and formatting of log events. Apache uses the Common Log Format (CLF) by default, but you can specify your own format string to change the fields included in each log.
You can also use the CustomLog directive to change the location of the log file. In Linux, Apache commonly writes logs to the /var/log/apache2 or /var/log/httpd directories depending on your OS and Virtual Host overrides. You can also define a LogFormat string after the filename, which will only apply the format string to this file.
For example, the following configuration writes logs to logs/access_log using the standard “common” format. The logs/ subdirectory is relative to the directory specified in the ServerRoot directive:
LogFormat "%h %l %u %t \"%r\" %>s %b" common
CustomLog "logs/access_log" common
CustomLog "logs/access_log" common
You can find a full list of fields in the Apache log documentation. We recommend using at least the following five fields, as they’re important for monitoring server health and troubleshooting issues:
LogFormat strings can be assigned nicknames, which you can then use with a CustomLog directive to write logs using the specified format. This allows you to use the same log format for several log files without having to redefine the format each time. This is particularly useful when using different log files for multiple virtual hosts.
Let’s create an example format and name it “vhost_combined.” We’ll then create a CustomLog directive designed to write logs to a file using the vhost_combined format.
LogFormat "%v:%p %h %l %u %t "%r" %>s %O "%{Referer}i" "%{User-Agent}i"" vhost_combined
CustomLog /var/log/apache2/vhost.log vhost_combined
Storing your logs as plain text makes them easier to scan in case you ever need to read your log files. However, this can also make it difficult to use tools such as log management solutions to read your logs, since these tools must know how your logs are formatted. While many log management solutions support the default Apache log format. If the solution you use doesn’t, you should consider using a structured format like JSON.
JSON (short for JavaScript Object Notation) is a flexible format for storing structured data. JSON stores a collection of nestable name/value pairs, letting you store almost any data type and structure. JSON also effectively self-documents, as the name of the key describes the data it contains. JSON supports many basic data types, including strings, numbers, Boolean operators, arrays, and null values.
Here’s an example of a LogFormat designed to store logs in JSON format:
LogFormat "{ \"time\":\"%t\", \"remoteIP\":\"%a\", \"host\":\"%V\", \"request\":\"%U\", \"query\":\"%q\", \"method\":\"%m\", \"status\":\"%>s\", \"userAgent\":\"%{User-agent}i\", \"referer\":\"%{Referer}i\" }"
Apache log files, particularly the access log, can grow to the point of consuming excessive disk space or becoming difficult to manage. Log rotation helps solve this problem.
Apache supports a rotatelogs program capable of rotating logs based on time or file size. However, the standard Linux logrotate command is available on most systems and is a good mechanism for Apache log rotation. On most systems, Apache will have a default plain text logrotate configuration file at /etc/logrotate.d/apache2 or /etc/logrotate.d/httpd.
Here’s an example of the default configuration file on Debian 11 of /etc/logrotate.d/apache2:
/var/log/apache2/*.log {
daily
missingok
rotate 14
compress
delaycompress
notifempty
create 640 root adm
sharedscripts
prerotate
if [ -d /etc/logrotate.d/httpd-prerotate ]; then
run-parts /etc/logrotate.d/httpd-prerotate
fi
endscript
postrotate
if pgrep -f ^/usr/sbin/apache2 > /dev/null; then
invoke-rc.d apache2 reload 2>&1 | logger -t apache2.logrotate
fi
endscript
}
You can modify the file with a text editor to customize your Apache log file rotation settings. Here’s a breakdown of what the different sections of the file mean:
Virtual hosts (vhosts) are used to run more than one website on a single Apache server. You can define a separate logging configuration for each vhost, which is given priority over the global logging configuration. This lets you log each website to a separate directory, for example. Leaving these parameters out defaults to the global logging configuration.
For example, the following configuration is for a vhost at example.com. Logs are written to separate access.log and error.log files in the /var/www/example.com/logs directory:
<VirtualHost *:80>
ServerName example.com
ServerAdmin webmaster@example.com
DocumentRoot /var/www/example.com
LogLevel info ssl:warn
ErrorLog /var/www/example.com/logs/error.log
CustomLog /var/www/example.com/logs/access.log example
</VirtualHost>
The following sections show the default configuration file locations and directives used in different Linux distributions.
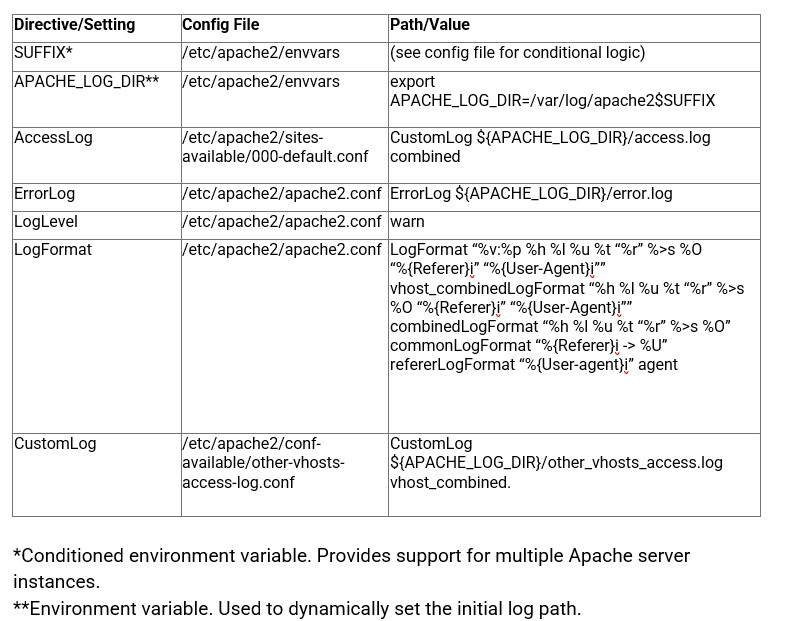
On Debian-based distributions, the default vhost configuration for unencrypted sites (port 80) can be found at /etc/apache2/sites-available/000-default.conf. The default vhost configuration for sites encrypted with SSL/TLS (port 443) is at /etc/apache2/sites-available/default-ssl.conf.
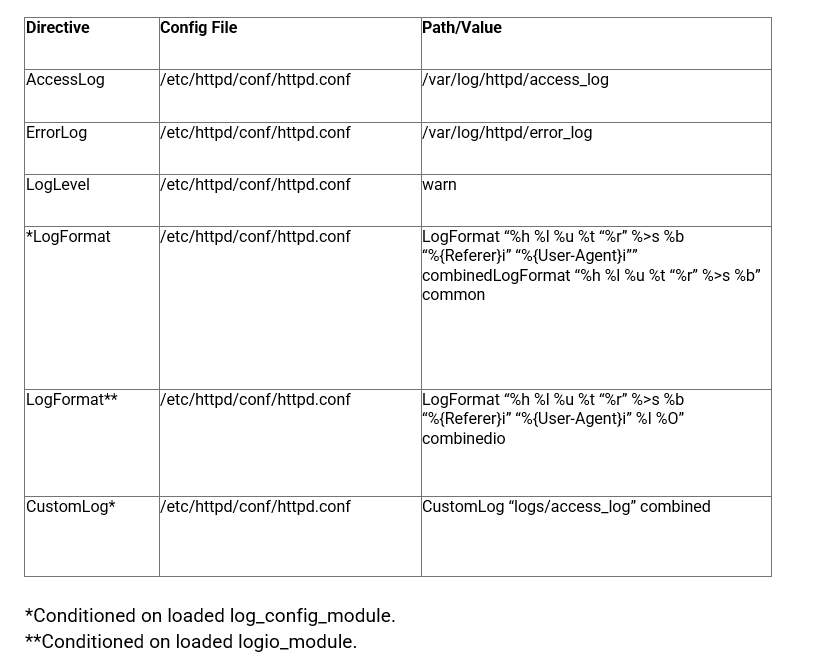
On Red Hat-based distributions, the main configuration file is located at /etc/httpd/conf/httpd.conf. You can place additional vhost config files in the /etc/httpd/conf.d directory, which is automatically read by the server on start.
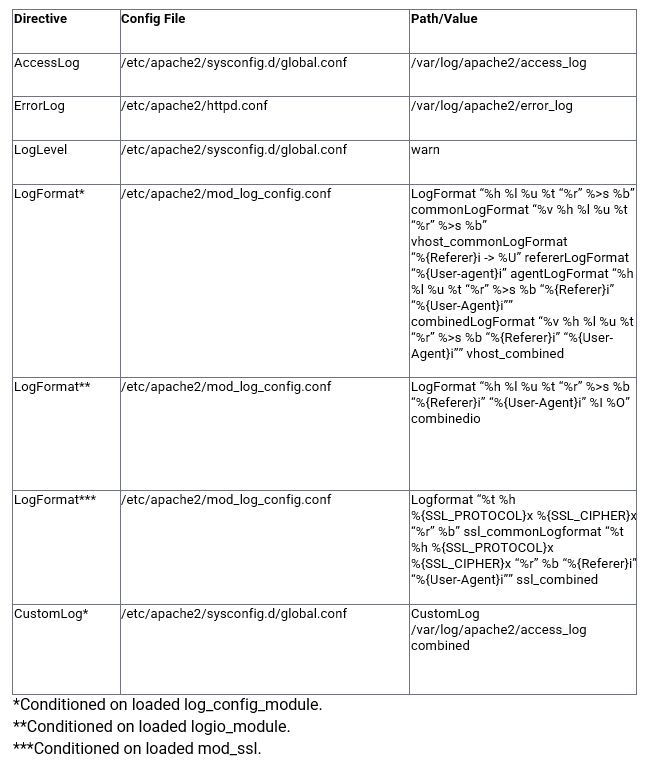
In OpenSUSE, the default vhost config for unencrypted sites (port 80) is located at /etc/apache2/default-vhost.conf, and the default config for sites encrypted with SSL/TLS is located at /etc/apache2/default-vhost-ssl.conf.
The Apache web server offers several modules designed to change the way Apache works or extend its capabilities. The following modules add or change the logging behavior in useful ways.
This is the base logging module Apache uses and the one we covered in this section of the guide.
This module provides additional options for logging debug messages. For example, you can log events to a specific URL path, log requests after they’re processed, log messages from a specific client if they result in timeouts, and more. Note this module is experimental and may not be included in your Apache distribution.
For example, the following configuration logs the IP address of a client whenever it requests a specific path:
<Location /path/to/some/specific/directory>
LogMessage "/path/to/specific/directory has been requested by"
${REMOTE_ADDR}
</Location>
This module enables logging before and after a request is processed. Each entry is assigned a unique ID, which can be used to trace events between the forensic log and normal log. However, the forensic logger doesn’t support custom formats. This module also supersedes the mod_unique_id module.
Once the module is enabled, you can use the forensic keyword to specify which log file is the forensic log. You can also use the %{forensic-id} pattern in other LogFormat strings to add forensic data to normal logs. Here, we use /var/www/example.com/logs/forensic.log:
<VirtualHost *:80>
ServerName example.com
ServerAdmin webmaster@example.com
DocumentRoot /var/www/example.com
LogLevel info ssl:warn
ErrorLog /var/www/example.com/logs/error.log
CustomLog /var/www/example.com/logs/access.log example
CustomLog /var/www/example.com/logs/forensic.log forensic
</VirtualHost>
Each line in the forensic log starts with either a “+” or “-” character. “+” indicates the entry log line for this particular request, and “-” indicates subsequent entries for the same request.
For example, the following entry log was generated by calling http://localhost using the default log format:
+3264:55958cb4:0|GET / HTTP/1.1|Host:localhost|Connection:keep-alive|
Cache-Control:max-age=0|
Accept:text/html,application/xhtml+xml,application/xml;q=0.9,image/webp,*/*;q=0.8|
User-Agent:Mozilla/5.0 (X11; Linux x86_64) AppleWebKit/537.36 (KHTML, like Gecko) Chrome/43.0.2357.130 Safari/537.36|
Accept-Encoding:gzip, deflate, sdch|
Accept-Language:en-US,en;q=0.8|
If-None-Match:"2cf6-519e8edfca429-gzip"|
If-Modified-Since:Thu, 02 Jul 2015 18%3a51%3a39 GMT
The ending log entry from the same request appears as follows:
-3264:55958cb4:0
If an ending entry doesn’t appear in the log, the request didn’t complete.
This module adds the ability to log the number of bytes sent and received per request. This includes bytes received, sent, and transferred (combination of received and sent). The module also accurately accounts for changes in size due to SSL and TLS encryption. This module requires mod_log_config and is typically included in Apache by default.
mod_logio adds the LogIOTrackTTFB On|Off directive, which toggles the ability to track the time to first byte (TTFB). TTFB is the amount of time from when a request is received to when the response is first sent to the client. You can then use %^FB to include the TTFB measurement in a LogFormat string.
This module provides context-sensitive filters to the output chain by registering any number of filter providers. mod_filter isn’t specific to logging but allows you to extract specific requests based on the filter provider. The context containers include main apache config, vhost config, within directory tags, and .htaccess files.
Employing this module allows for filtering requests containing items such as certain injection criteria and which IP address it’s from.
This module is provided by default in many of the package distributions but may require enabling. For the purposes of logging, the FilterTrace directive posts information to the error log. Directives include the following:
AddOutputFilterByType—assigns an output filter to a particular media typeFilterChain—configures a filter chainFilterDeclare—declares a smart filterFilterProtocol—causes the mod_filter to handle response headers correctlyFilterProvider—registers filter providersFilterTrace—allows for debugging/diagnostic information to an error log prior to provider processingThe following example applies filtering in a vhost context container conditionally on the filter and include modules:
<IfModule mod_filter.c>
<IfModule mod_include.c>
#Declare a resource type filter:
FilterDeclare xss
#Register a provider:
FilterProvider xss INCLUDES %{REQUEST_FILENAME}="(/[<>]+)$"
#FilterProvider ...
#Build the chain:
FilterChain xss
#Declare a custom log:
CustomLog /var/www/log/xss.log xss
#Format the log entry:
LogFormat "%h %u %t "%r" %>s "%{Referer}i" "%{User-Agent}i"" xss
</IfModule>
</IfModule>
This module constructs an environment variable and a unique identifier for each request. It’s often included in package distributions but may require enabling. This unique identifier is written to the access log.
This module has been superseded by mod_log_forensic for forensic purposes but is still supported for others.
Unlike the forensic identifier, the unique identifier is passed to the application handler via the environment variable UNIQUE_ID. This allows application developers to trace a request through the web server to the application server. It can be useful for debugging a request.
Apache spins off child processes to handle requests, and a child instance processes several requests at a time. As a result, it’s sometimes desirable to use a unique identifier to identify a single request across multiple server instances and child processes.
Once enabled, the module provides an identifier by default to the application handler.
For example:
UNIQUE_ID: Vaf3en8AAQEAAAtoQlAAAAAA
The identifier is constructed from a 32-bit IP address, 32-bit process ID, 32-bit timestamp coupled to a 16-bit counter for tighter resolution than a single-second, and 32-bit thread index. The timestamp component is UTC to prevent issues with daylight savings time adjustments. The application handler should treat the identifier as an opaque token only and not as a token dissected into constituents.
Last updated 2022
Need more options? Don’t miss the SolarWinds Apache Log Analyzer