Technical Resources
Educational Resources
APM Integrated Experience
Connect with Us
Logs are records of events that happen on your computer, either by a person or by a running process. They help you track what happened and troubleshoot problems.
The Windows event log contains logs from the operating system and applications such as SQL Server or Internet Information Services (IIS). The logs use a structured data format, making them easy to search and analyze. Some applications also write to log files in text format. For example, IIS Access Logs.
This article explores the Event Viewer interface and features, and introduces other major application and services logs. Examples are provided to give you a full grasp of how monitoring events can help you manage your systems for health and security.
Windows Event Viewer displays the Windows event logs. Use this application to view and navigate the logs, search and filter particular types of logs, export logs for analysis, and more. We’ll show you how to access Windows Event Viewer and demonstrate available features.
Windows Server 2019 Event Viewer can be accessed in several ways:
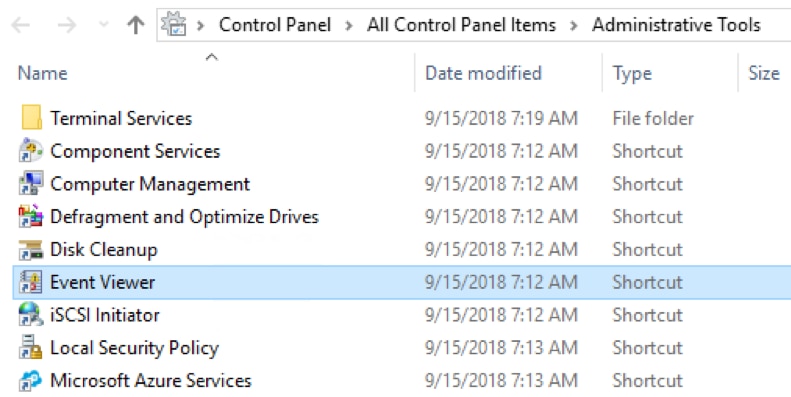
Control Panel is the standard Windows component for viewing and changing system settings. It can be found in Windows Server and Windows desktop editions. To access the Event Viewer:
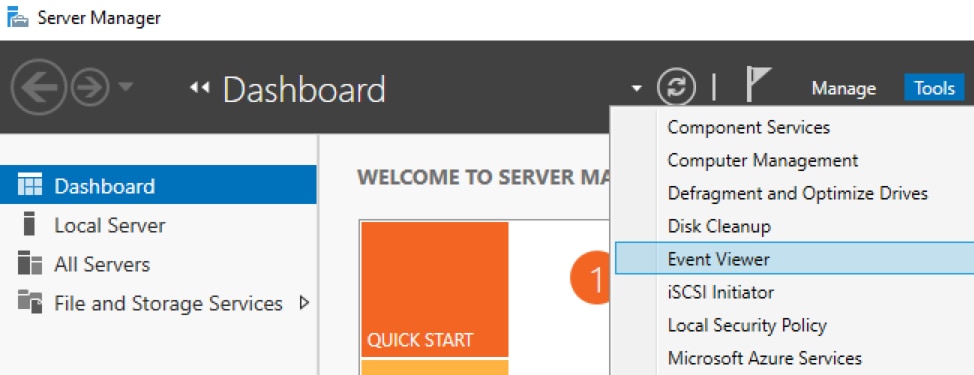
The Server Manager console lets you manage settings on the local server and on remote servers. To access Event Viewer from Server Manager:
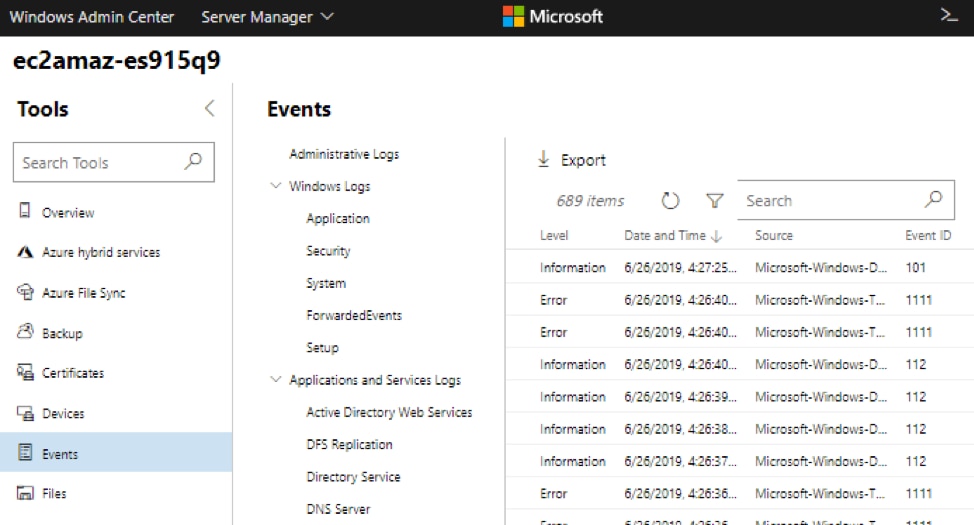
Windows Admin Center is a browser-based application for managing servers, clusters, desktop PCs, and other infrastructure components. To access Event Viewer from the Windows Admin Center:
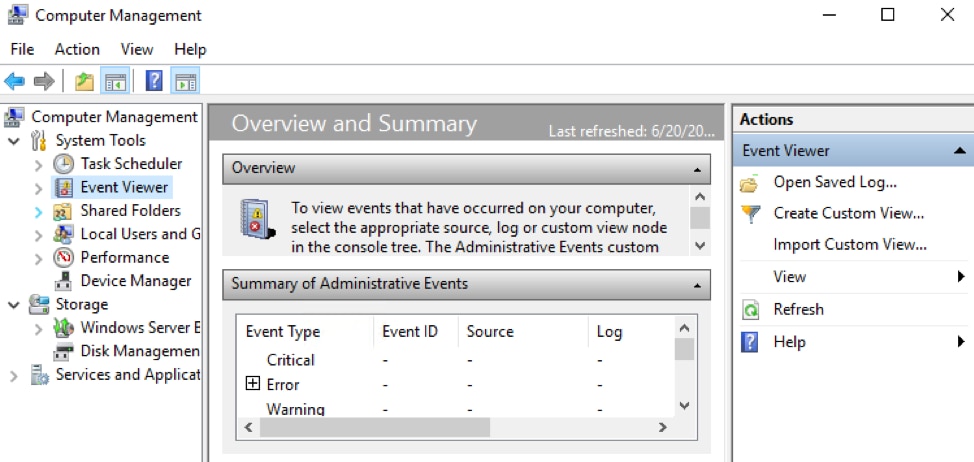
The Computer Management console provides access to administrative tasks on a local or remote server. To open Event Viewer from Computer Management:
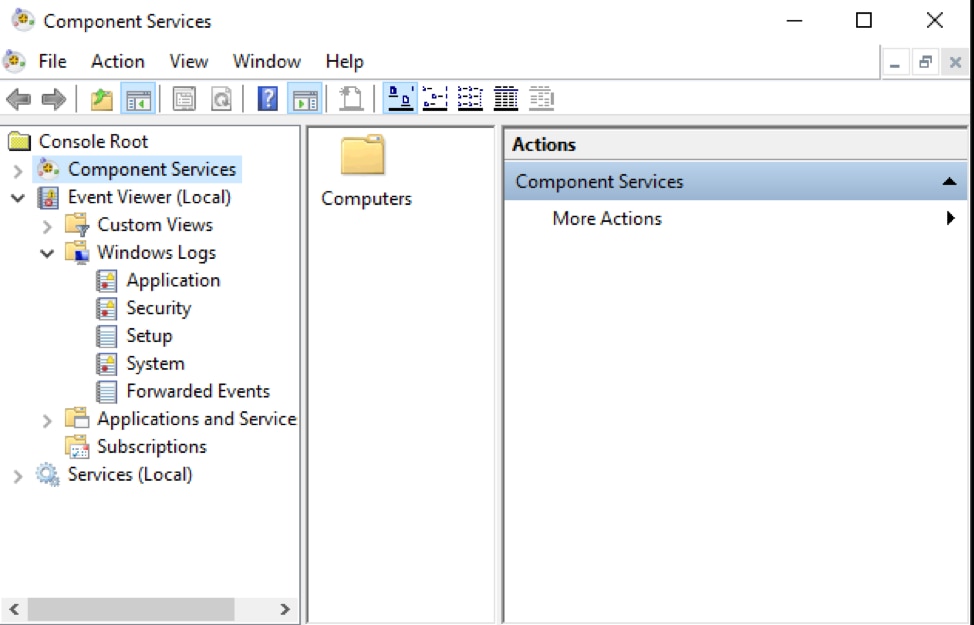
Another built-in application is the Windows Component Services Manager that enables us to configure DCOM applications running on Windows. Windows Event Viewer is accessible from Component Services Manager as well:
Lastly, you can open the Event Viewer directly from a command prompt. To do so:
Event Viewer has an intuitive user interface. The main screen is divided into three sections:
You can create Summary and Custom views. We’ll guide you through these options.
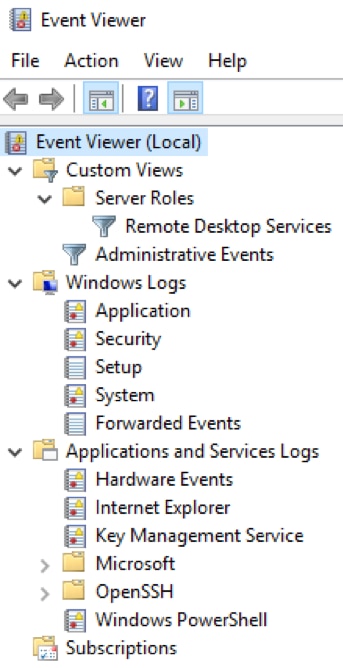
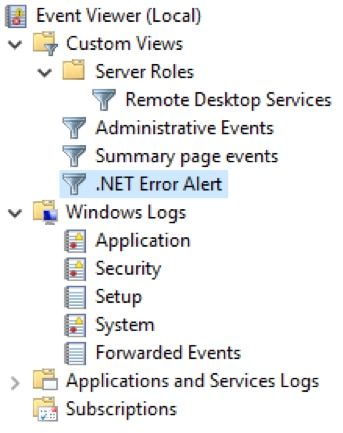
The Navigation pane is where you choose the event log to view. By default, there are five categories of Windows logs:
There is also a section for Applications and Services Logs, including categories for Hardware Events, Internet Explorer and Windows PowerShell events.
Event Viewer Navigation pane:
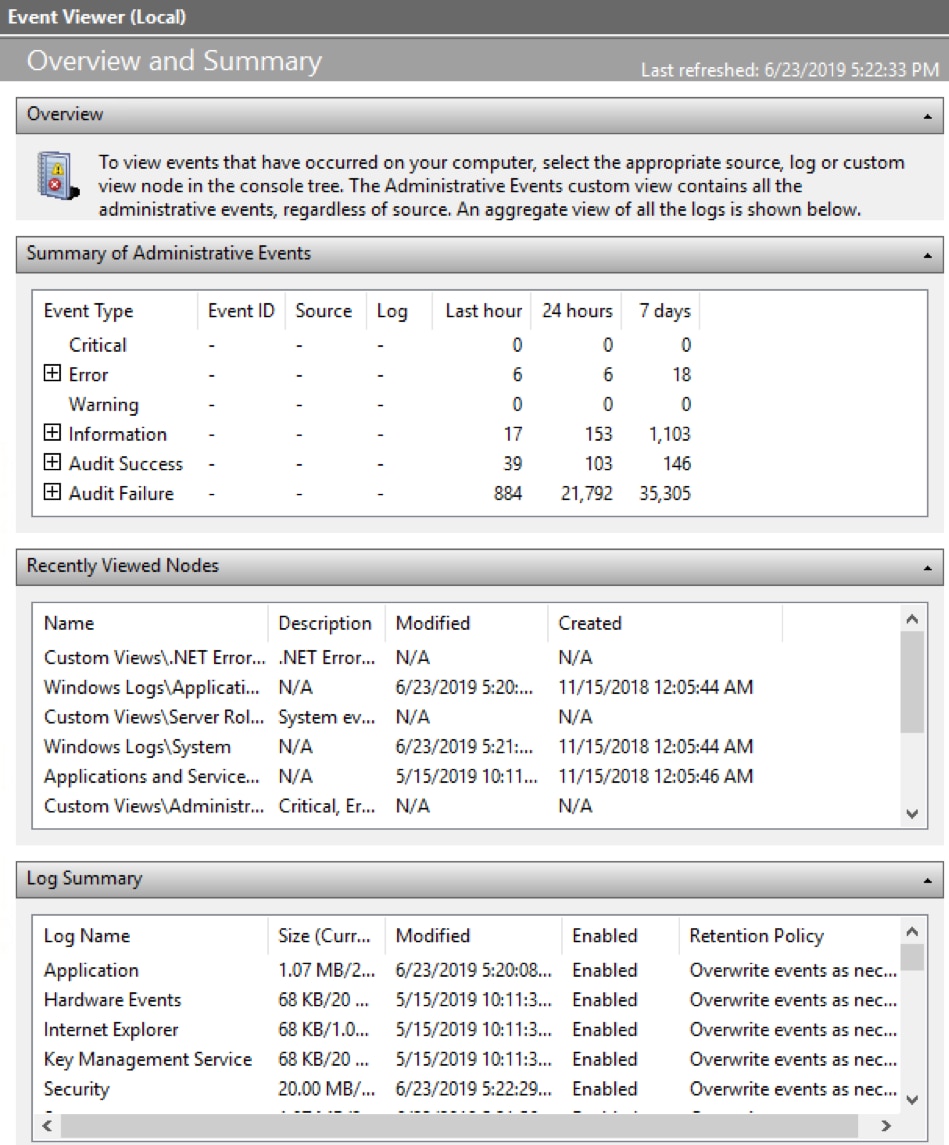
When Event Viewer is opened, the Detail pane displays the Overview and Summary. We’ll discuss the Summary Views later. Select an item from the Navigation pane to see a list of events.
Event entries are listed by default in chronological order, with the latest events at the top. Click on any column header to sort events by that field in ascending or descending order. Clicking a second time in the same column head reverses the sort order. For example, click on Level to sort by severity. A caret ^ symbol or reverse caret indicates the sort field and direction of the sort.
Each event has a severity Level:
| Information messages indicate a successful action. | |
| Warning messages indicate an event occurred that might become a problem. | |
| Error messages indicate a significant problem occurred. | |
| Critical messages indicate a severe problem occurred. | |
| Audit success is associated with security events. | |
| Audit failure is associated with security events. |
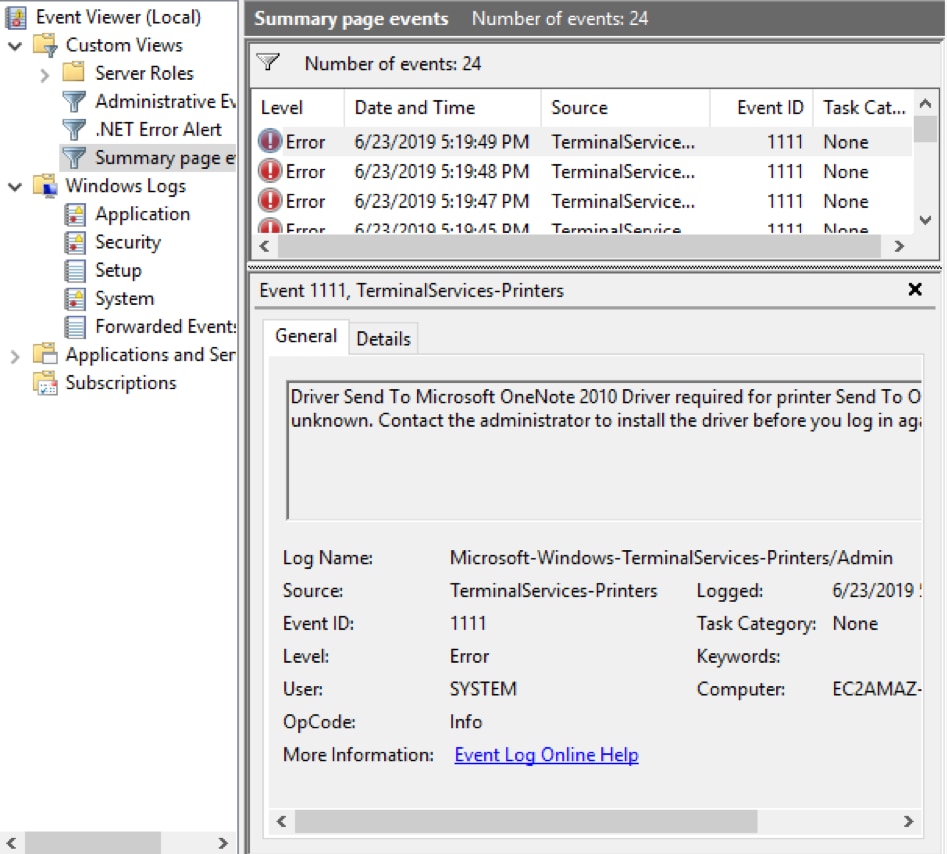
Event Viewer Detail pane showing errors and warnings:
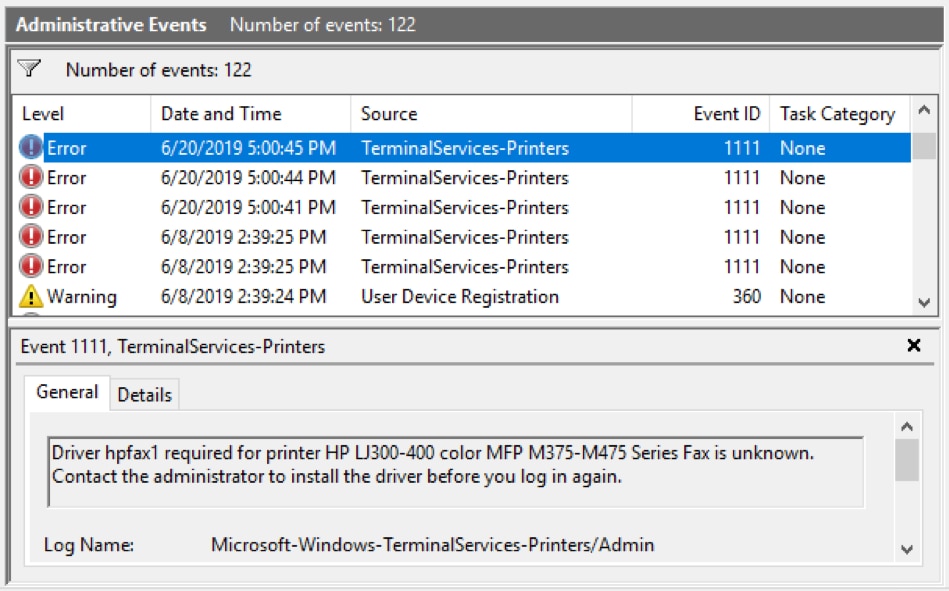
Click on an event to display the detailed information. In this example, we can see the highlighted event’s source (TerminalServices-Printers) and the date and time it occurred. The General tab shows more information: a printer driver needs to be installed.
Event Viewer Detail pane General tab:
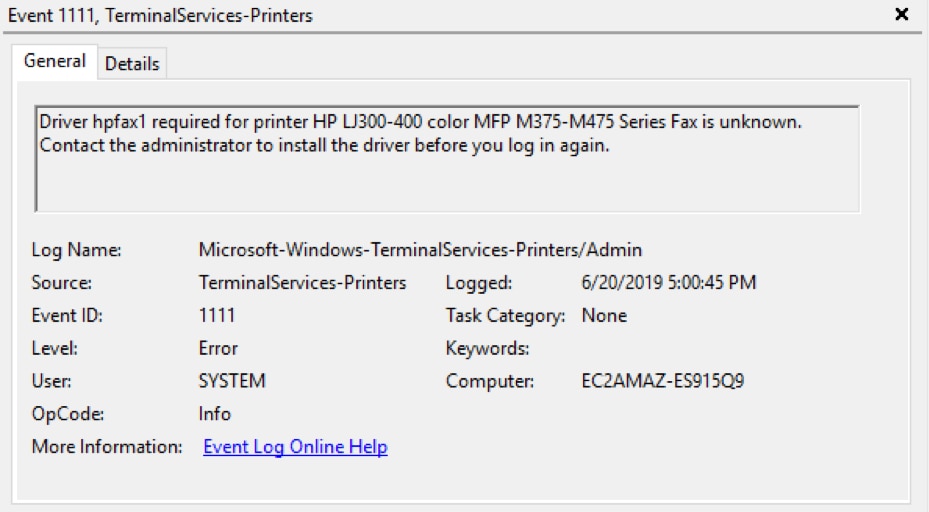
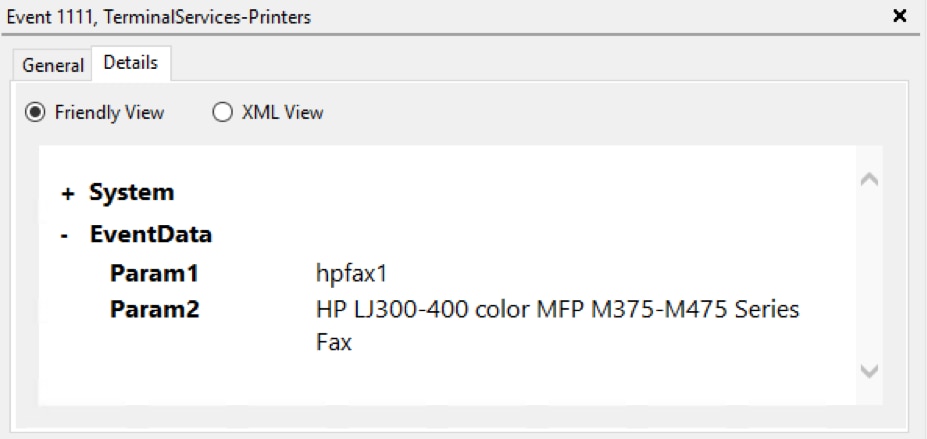
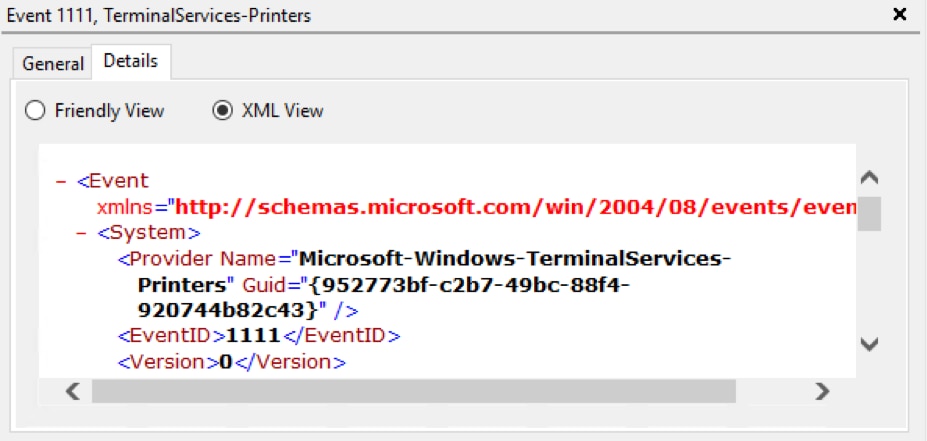
Open the Details tab to view the raw event data. You can switch between Friendly View and XML View.
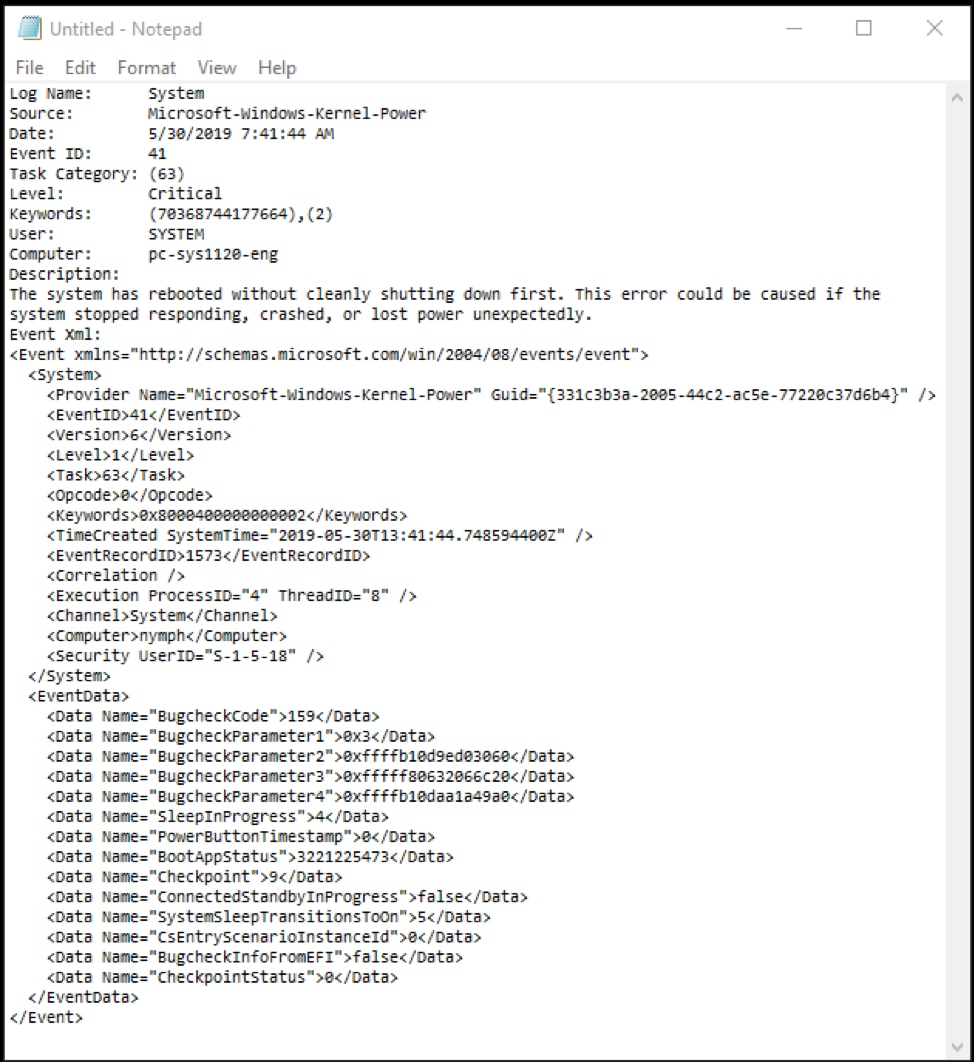
You can right-click on an event and select Copy > Copy Details as Text then paste the results into a text editor. The system fields are listed, followed by the entire event as XML.
For this critical error, we can see the system had shut down unexpectedly.
The Actions pane provides quick access to actions available for your current selections. The Action pane is divided into two sections:
In this example, we have selected the Application log and Event 9027, Desktop Window Manager:
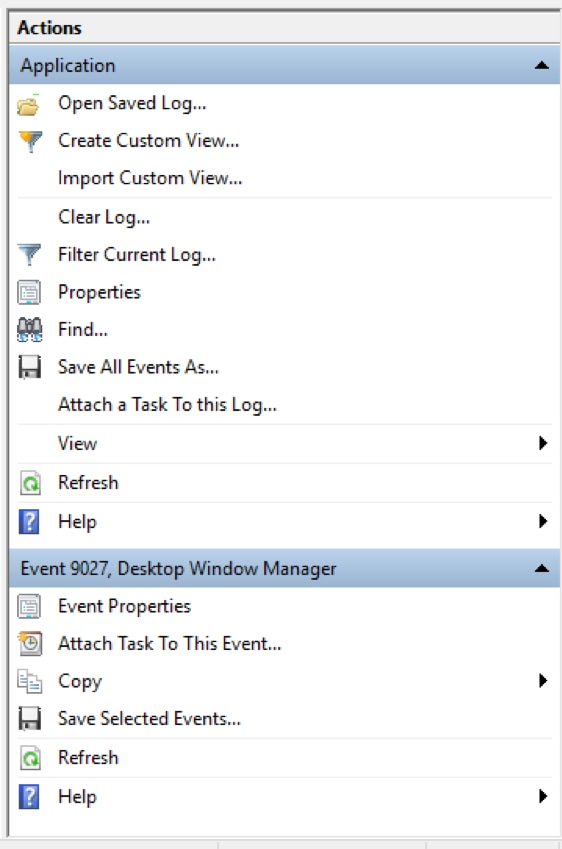
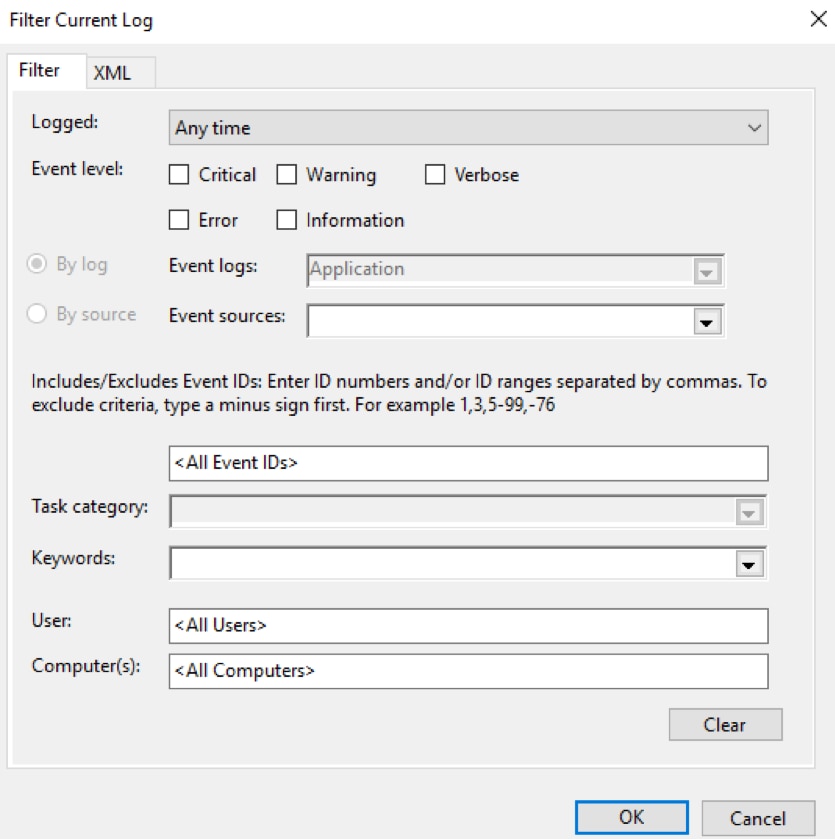
As you can see, there are a number of actions possible when a particular event log is active. For example, click Filter Current Log to search for a particular event or group of events. The pop-up window enables you to specify query criteria. When you click OK, your filtered results are shown in the Details pane.
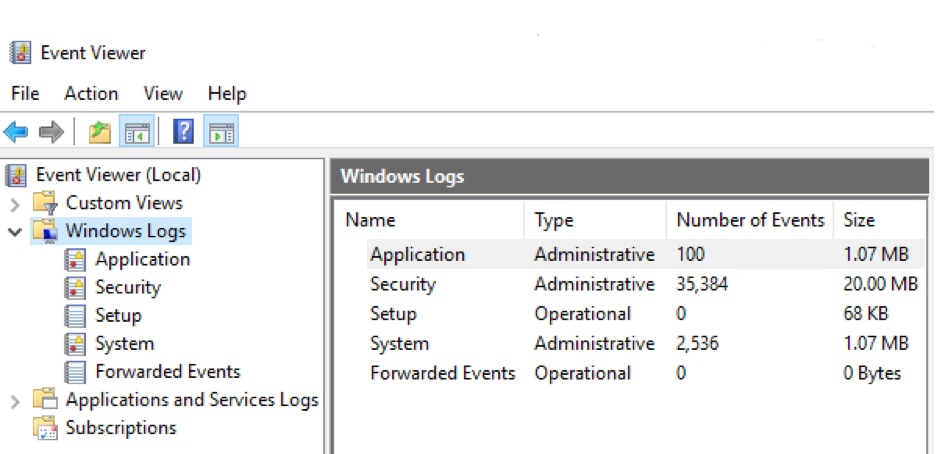
You can do some housekeeping on the selected log with the Clear Log action if it becomes too large. This deletes all events stored in the log. To check the size of your log files, select Windows Logs or Applications and Services Logs from the Navigation pane. The Number of Events and Size are shown in the Detail pane.
You can click Save All Events As or Save All Events in Custom View As (selected events) or Save All Events As (all events) to export events from the current log to an event file. The event file has an EVTX extension.
Where would you use such functionality? Suppose you want to send your system’s health status to a third-party vendor—you can provide them with an exported event file. Or, you can archive your logs before deleting them, or send your saved logs to a centralized backup medium. Saving event logs to an event file comes in handy. Administrators click on Open Saved Log and navigate to the log location to open the saved log.
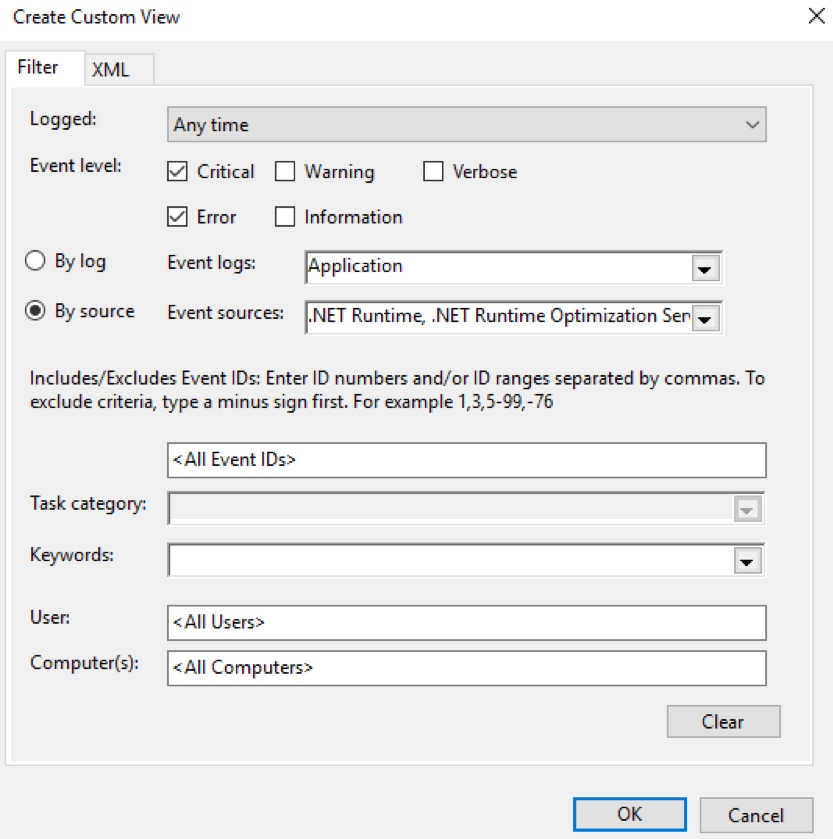
Event Viewer enables you to easily create custom views. This provides quick access if you are interested in certain types of event or events based on severity level.
Create a Custom View:
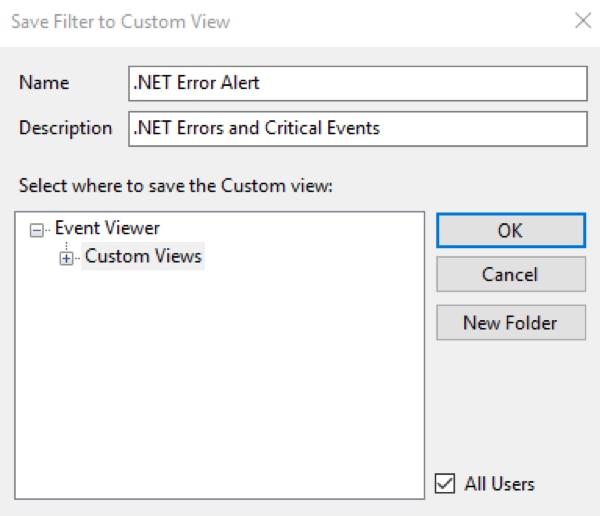
Your Custom View is now available.
Similar to saving logs in an event file, you can export Custom Views.
The XML file can be imported into Event Viewer on another system by clicking Import Custom View and navigating to the location of the file.
Event Viewer (Local) is the top node in the Navigation pane. When selected, the Overview and Summary displays in the Details pane.
Looking at this example, there were six errors trapped in the last hour, and the number of errors in the last week was 18. Click + to expand the Error listing:
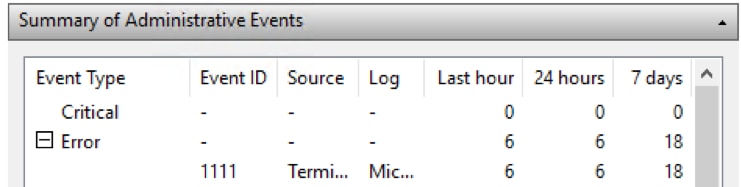
Double-click on an error to open it in the Details pane.
There are other logs with their own event viewing mechanisms in Windows:
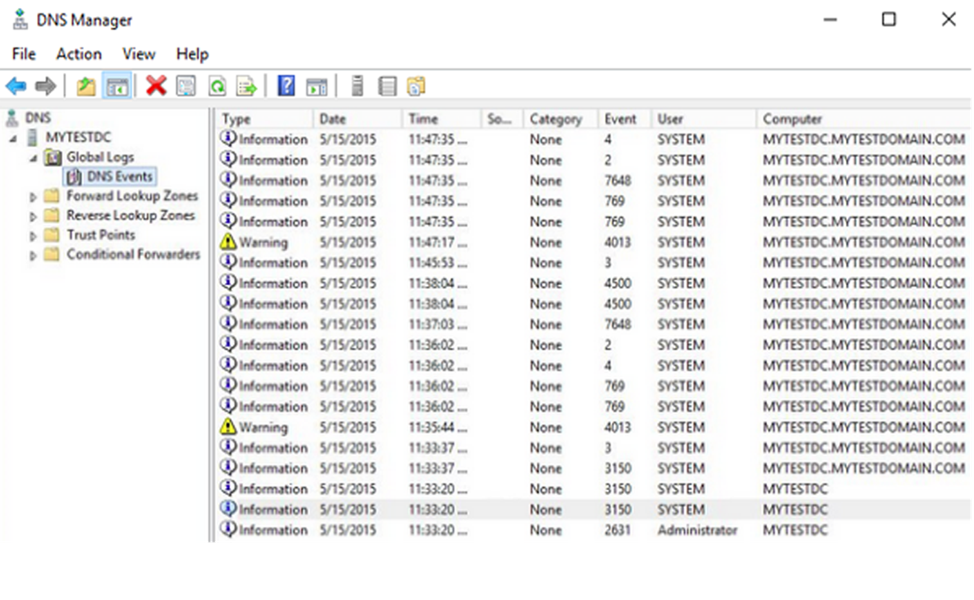
If the Windows Server is provisioned as a Domain Name Service (DNS) server, the DNS Manager is installed. In small networks, this is typically the Active Directory Domain Server.
DNS Manager has its own list of events:
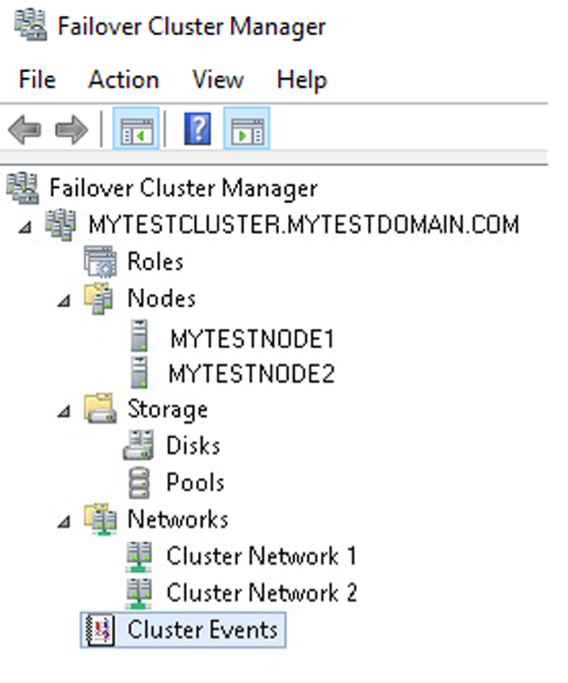
Windows Server Failover Clustering service enables two or more Windows servers to work as a cluster—a fault-tolerant configuration where one server’s physical hardware failure is automatically detected and replaced by the other server. Windows Server Failover Clustering service automatically re-routes all network traffic to the healthy instance, creating a highly available environment. In a cluster, applications connect to a common access point—a virtual IP or a cluster name—and Windows routes all traffic to the correct node. When a fault does happen, applications continue to work as usual. Windows Server Failover Clustering is used as the foundation of modern SQL Server HA solutions like AlwaysOn Availability Groups.
The Failover Cluster Manager is a Windows built-in application with its own Event Viewer. Using this Event Viewer, system administrators can troubleshoot when their cluster fails or stops functioning as expected. The following screenshot shows the Cluster Manager event viewer node in the Navigation pane. Selecting this node will show cluster-related events.
The Internet Information Services access logs include information about requested URIs and status indicating whether the response was successfully served. It writes these logs as files in the W3C Extended Log Format. This format is a type of comma-separated value (CSV). The log file location is specified within the IIS Manager Logging settings. By default, the location is:
%SystemDrive%\inetpub\logs\LogFilesFor example, here’s a log file on C:, with W3SVC1 as the virtual host and u_ex150428 as a file name coded with the date 2015-04-28:
C:\inetpub\logs\LogFiles\W3SVC1u_ex150428.logHere’s an excerpt from the log file. The column definition is in a comment. The request for /manager/html returned a 404 status code as the page doesn’t exist.
#Software: Microsoft Internet Information Services 7.5
#Version: 1.0
#Date: 2015-04-28 12:12:05
#Fields: date time s-ip cs-method cs-uri-stem cs-uri-query s-port cs-username c-ip
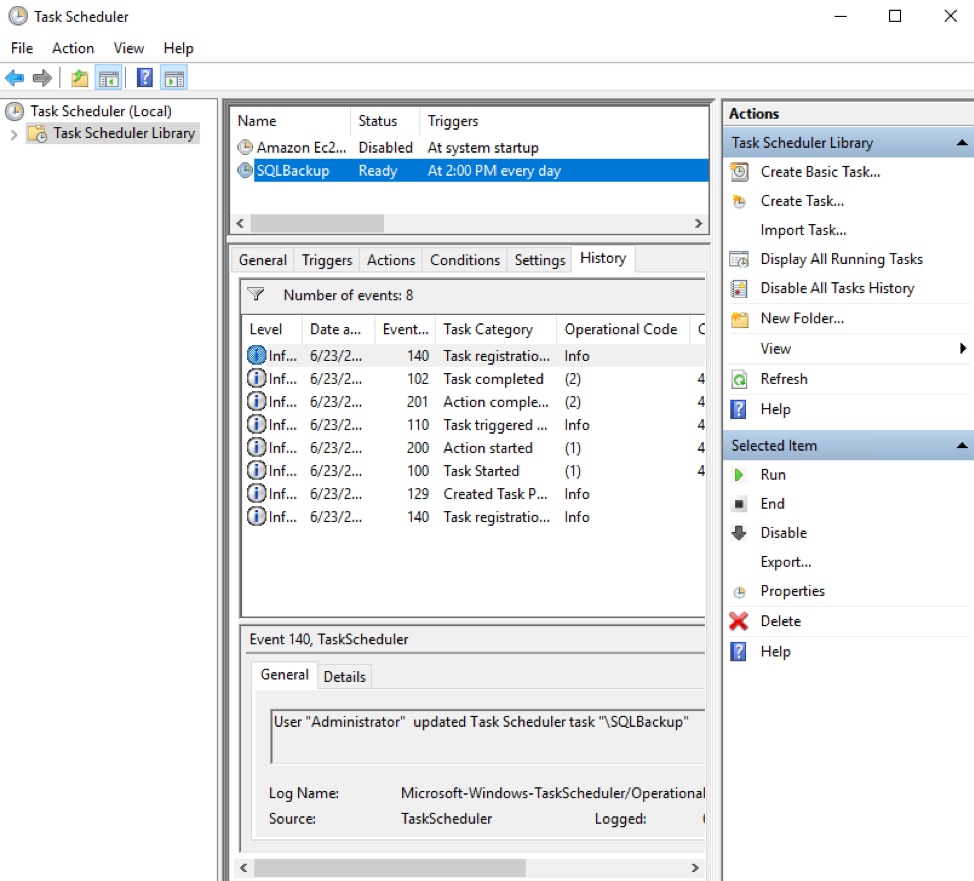
2015-04-28 02:51:38 10.211.14.109 GET /manager/html - 80 - 222.186.56.21 Mozilla/5.0+(compatible;+MSIE+10.0;+Windows+NT+6.2;+WOW64;+Trident/6.0) - 404 0 64 4850Task Scheduler runs background tasks and applications on a scheduled basis, much like the Linux cron subsystem. An example is a nightly backup script that backs up local SQL Server databases.
Each task has associated history events you can view in the Task Scheduler Detail pane:
Windows and associated applications record various events in multiple logs. Trapping and understanding these events are a key part of a system administrator’s role. This guide explores how you can use different methods to collect, centralize, and protect these logs.
Windows PowerShell gives administrators a programmatic way to interact with Windows logs. The older Get-EventLog uses a deprecated Win32 API, so we’ll use the Get-WinEvent for our examples here. With Get-WinEvent, you can view a variety of Windows logs including the Application, System, and Security logs.
To list all available logs on a system, use this command:
Get-WinEvent -ListLog *
The output will look similar to this:
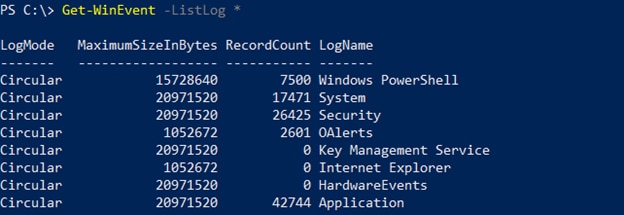
Here is what each of the column names means:
To list logs on a Windows system, you can use the command:
Get-WinEvent -LogName <LogName>
Where <LogName> is the name is one of the logs in the output of Get-WinEvent -ListLog *.
For example, to view all the Application log records on a local Windows system, use this command:
Get-WinEvent -LogName 'Application'
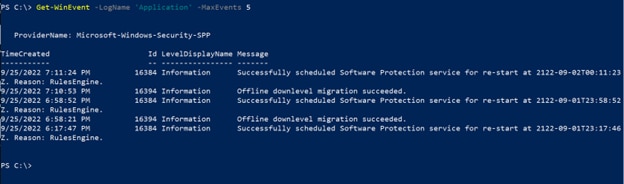
In many cases, log files contain hundreds of lines of records. To limit how many records are displayed, use the -MaxEvents parameter. For example, to view only the last 5 Application log records, use this command:
Get-WinEvent -LogName 'Application' -MaxEvents 5
If you know what log file and event ID you’re looking for, PowerShell hashtables make it easy to filter through Windows Logs. Hashtables use key/value pairs to simplify PowerShell queries.
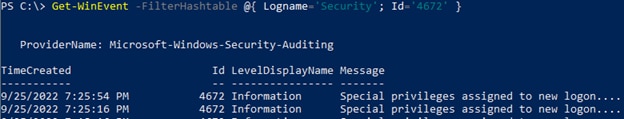
For example, to list all Security log entries with ID 4672 (Special privileges assigned to new logon), use this command:
Get-WinEvent -FilterHashtable @{ Logname='Security'; Id='4672' }
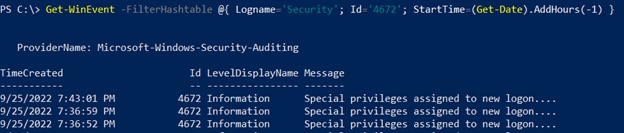
To further refine your PowerShell log searches, you can use the Get-Date cmdlet in your query. For example, to limit our query of Security log entries with ID 4672 to the last hour, we can use this command:
Get-WinEvent -FilterHashtable @{ Logname='Security'; Id='4672'; StartTime=(Get-Date).AddHours(-1) }
The Get-Date cmdlet allows for similar filters for other units of time as well. They are:
Last updated: December 2022
Want something different? Try the SolarWinds Windows Event Log Monitoring