Technical Resources
Educational Resources
APM Integrated Experience
Connect with Us
You can use the tools in this article to centralize your Windows event logs from multiple servers and desktops. By properly administering your logs, you can track the health of your systems, keep your log files secure, and filter contents to find specific information.
Centralizing your logs saves time and increases the reliability of your log data. When Windows log files are stored locally on each server, you have to individually log in to each one to go through them and look for any errors or warnings. If the server is unresponsive, you might be out of luck. If you aren’t sure which servers are affected, you have to hunt through each one, which can take a long time on large networks. The log files are also safer in a centralized location because even when your instances are terminated or your files are deleted (intentionally or unintentionally), the centralized backup copies of your logs are unaffected.
It is possible for a Windows server to forward its events to a collector server. In this scenario, the collector server becomes a central repository for Windows logs from other servers (called event sources) in the network. The stream of events from a source to a collector is called a subscription.
This procedure demonstrates how to set it up. These steps work on Windows Server 2008 R2, Windows Server 2012, and Windows Server 2019.
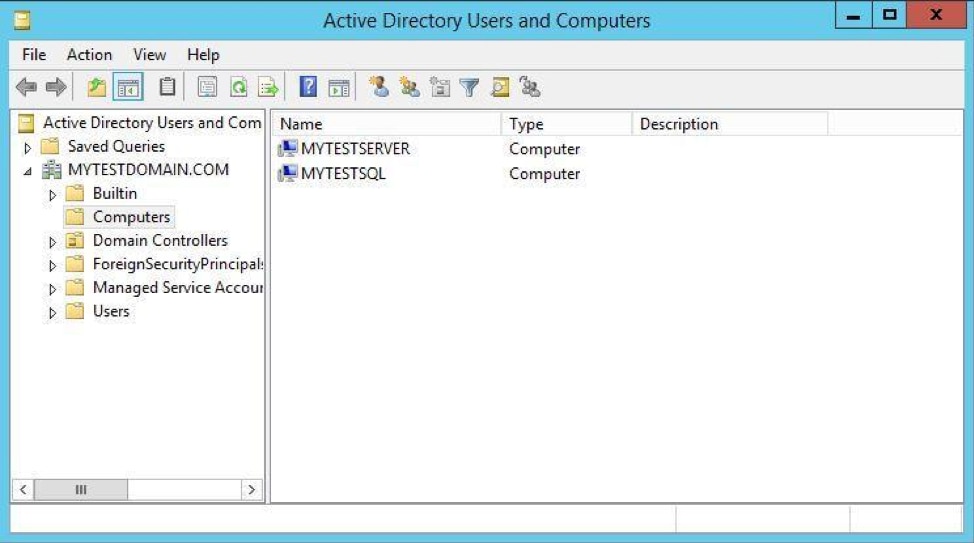
We are using two Active Directory Domain–joined Windows Server 2012 systems. The domain name is mytestdomain.com and both machines are registered with the domain.
Source server MYTESTSQL hosts a SQL Server 2014 instance. Collector server MYTESTSERVER works as an event log subscriber to centralize all SQL Server-related logs from MYTESTSQL.
Windows Remote Management (WinRM) is a protocol for exchanging information across systems in your infrastructure. You must enable it on each of your source computers to exchange log files.
winrm quickconfig
If it is already running, a message similar to this example is displayed.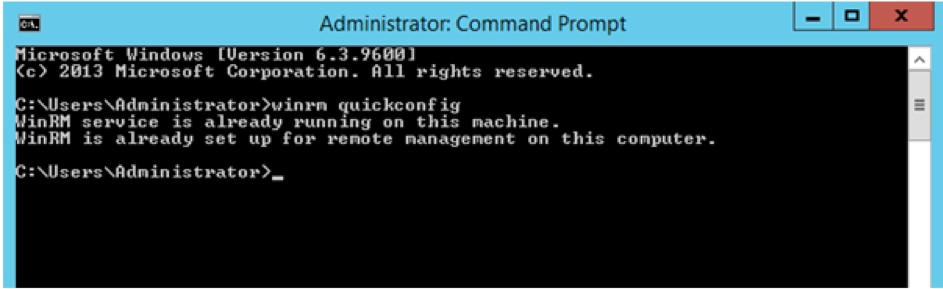
You must enable the Windows Event Collector Service on your collector server to allow it to receive logs from your sources.
wecutil qcin
If prompted like the example, press y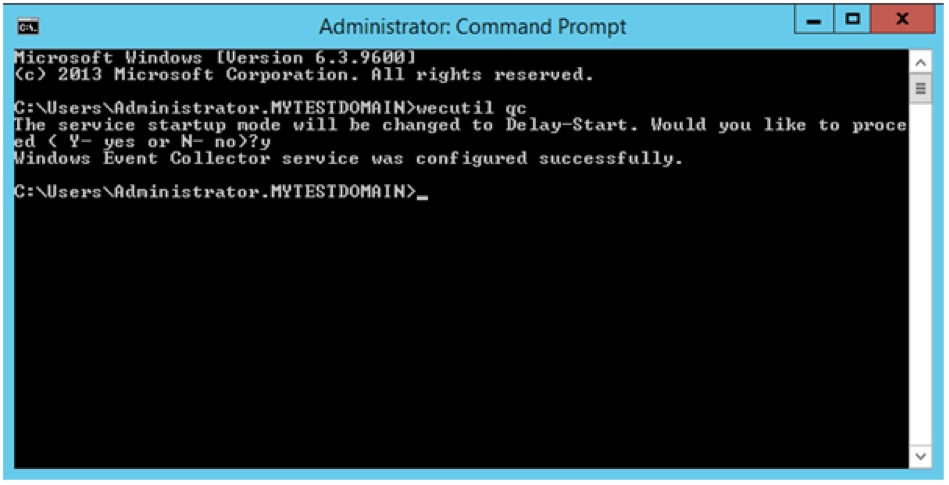
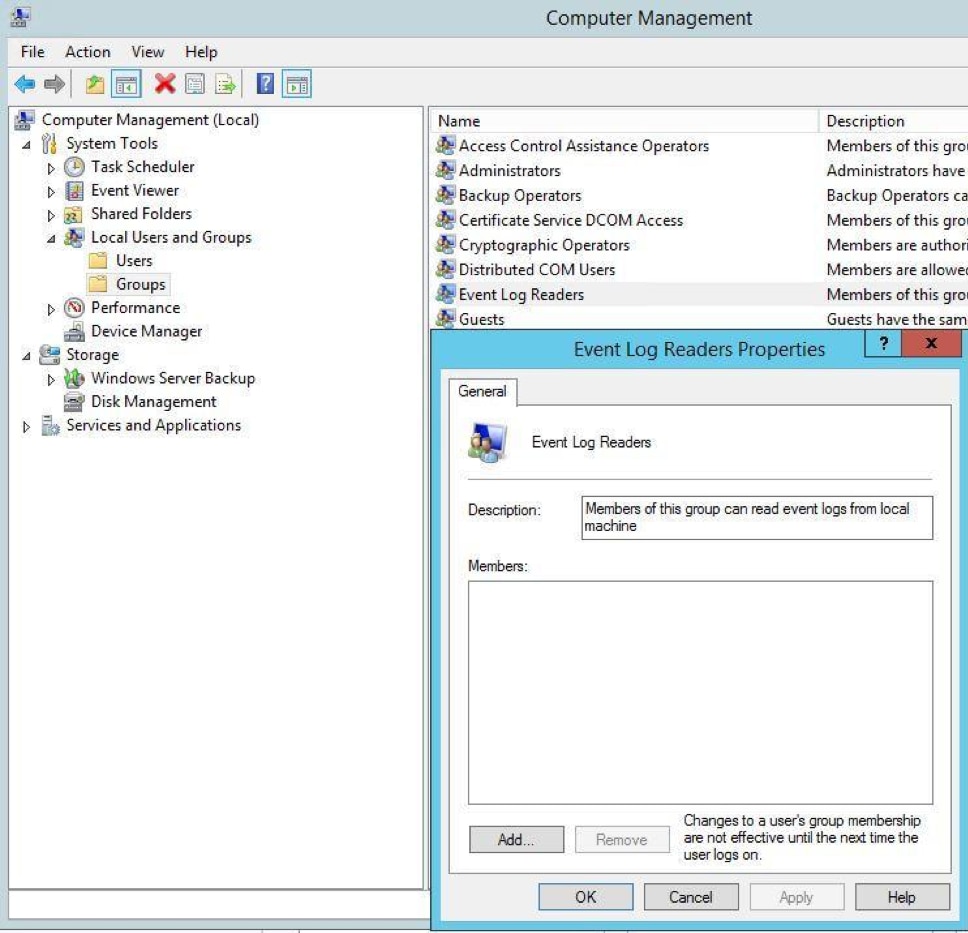
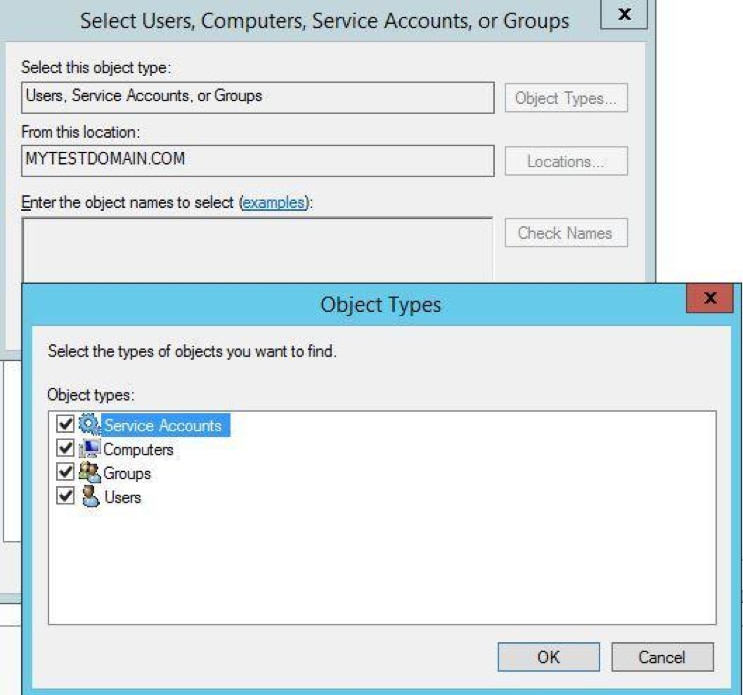
By default, certain logs are restricted to administrators. This may cause problems when receiving logs from other systems. To avoid this, you can grant access to the collector computer by adding it to the Event Log Readers group.

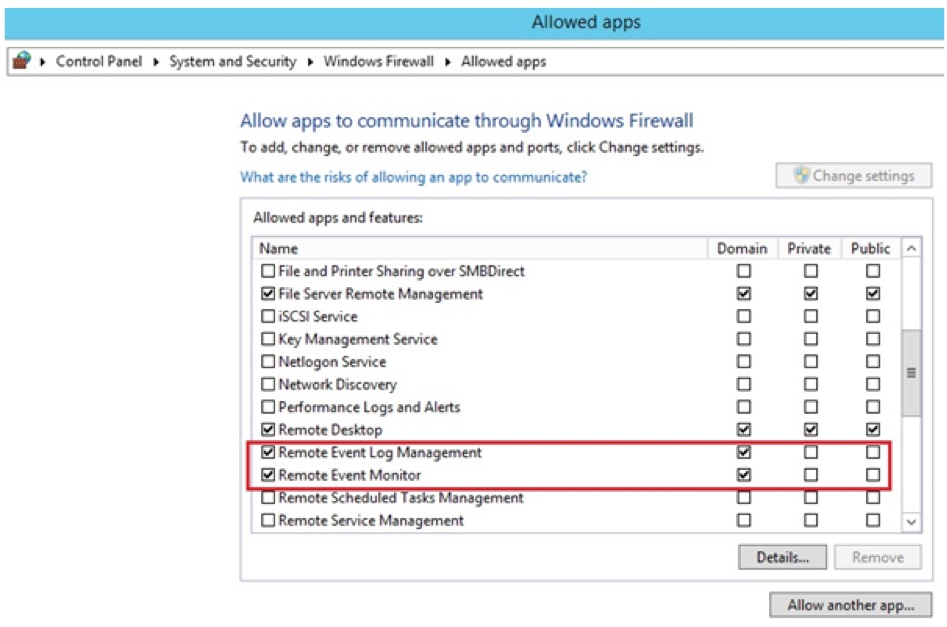
If the source computer is running Windows Firewall, ensure it allows Remote Event Log Management and Remote Event Monitor traffic.
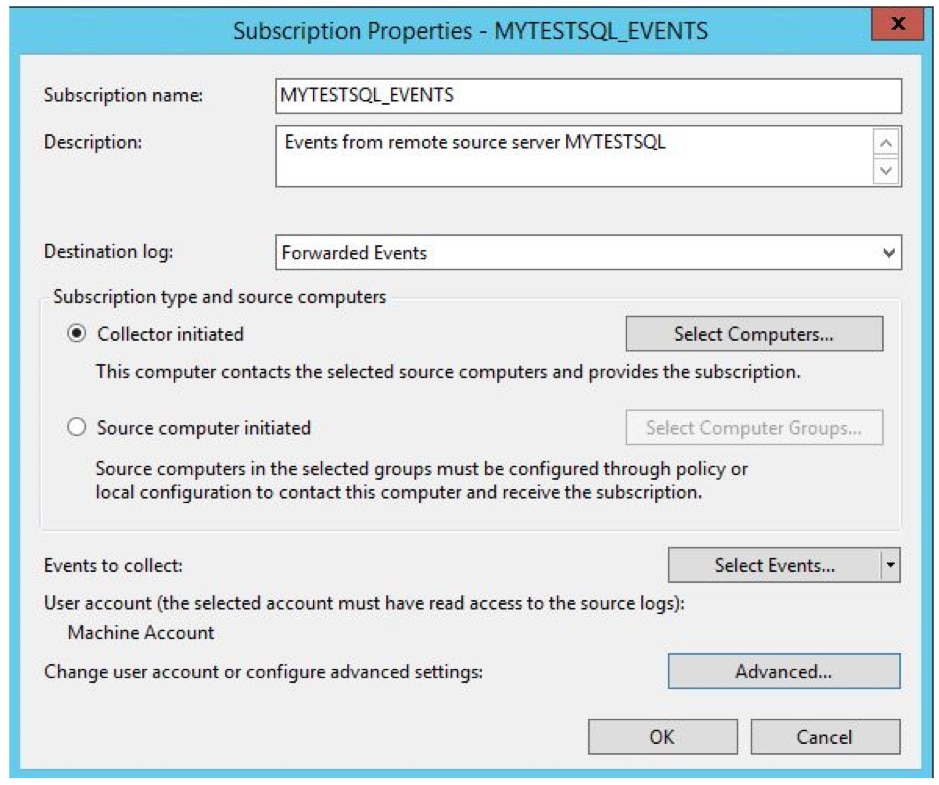
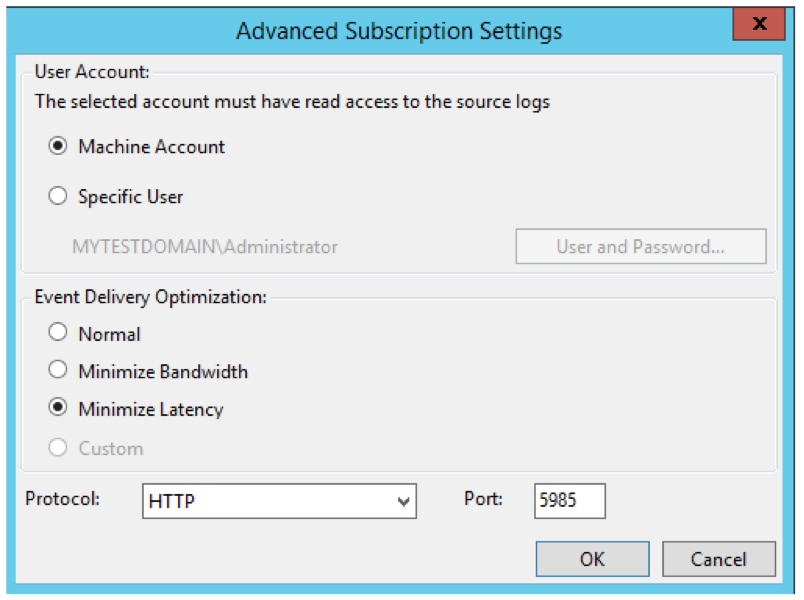
Subscriptions define the relationship between a collector and a source. You can configure a collector to receive events from any number of sources (a source-initiated subscription), or specify a limited set of sources (a collector-initiated subscription). In this example, we create a collector-initiated subscription since we know which computer logs we want to receive.
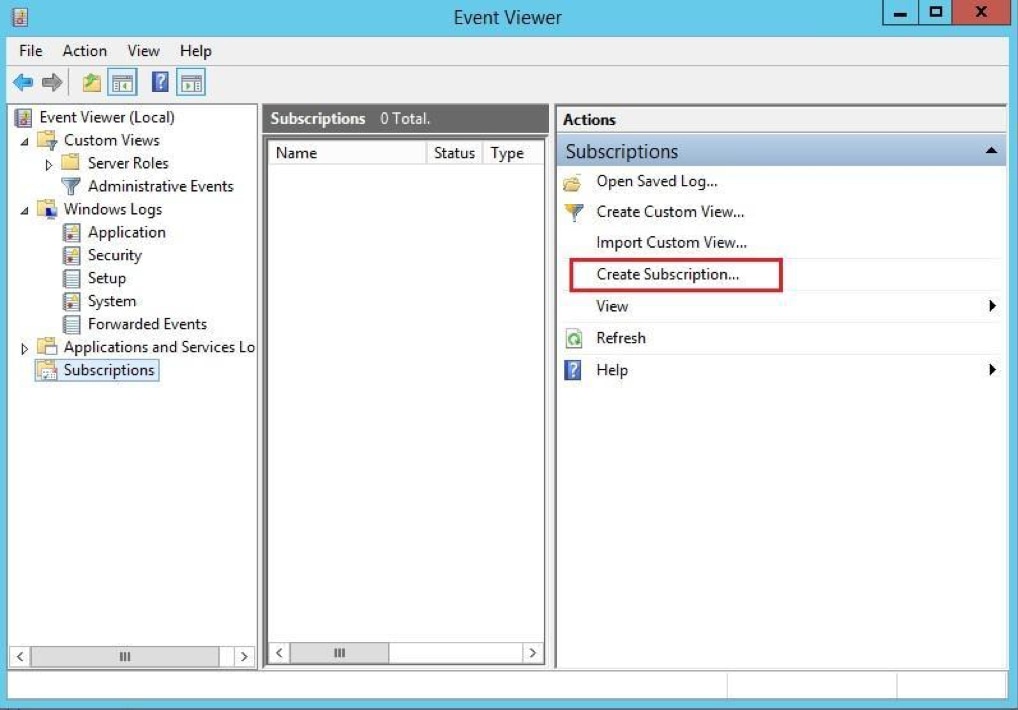

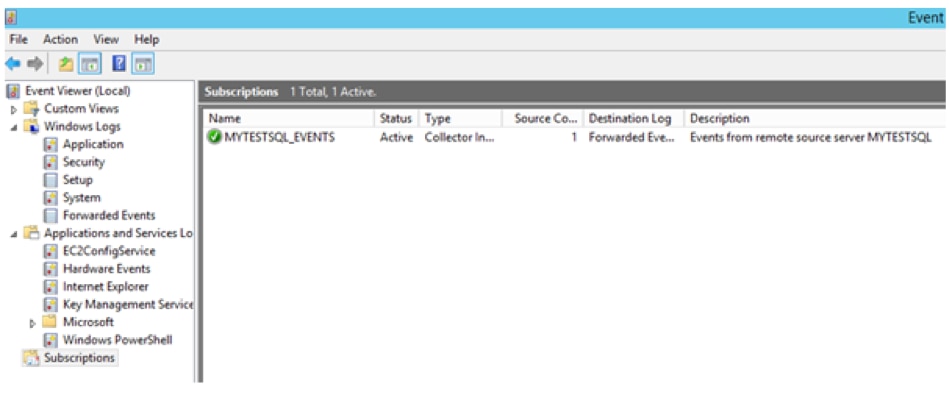
The Subscription node in the collector computer event viewer now shows the new subscription.
Select Forwarded Events from the Navigation pane on the collector computer.
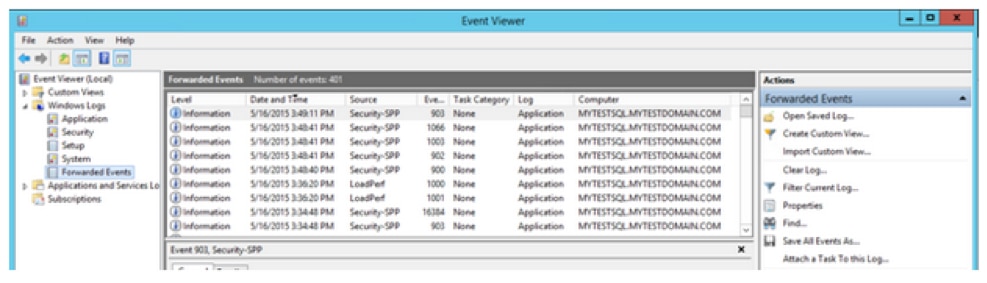
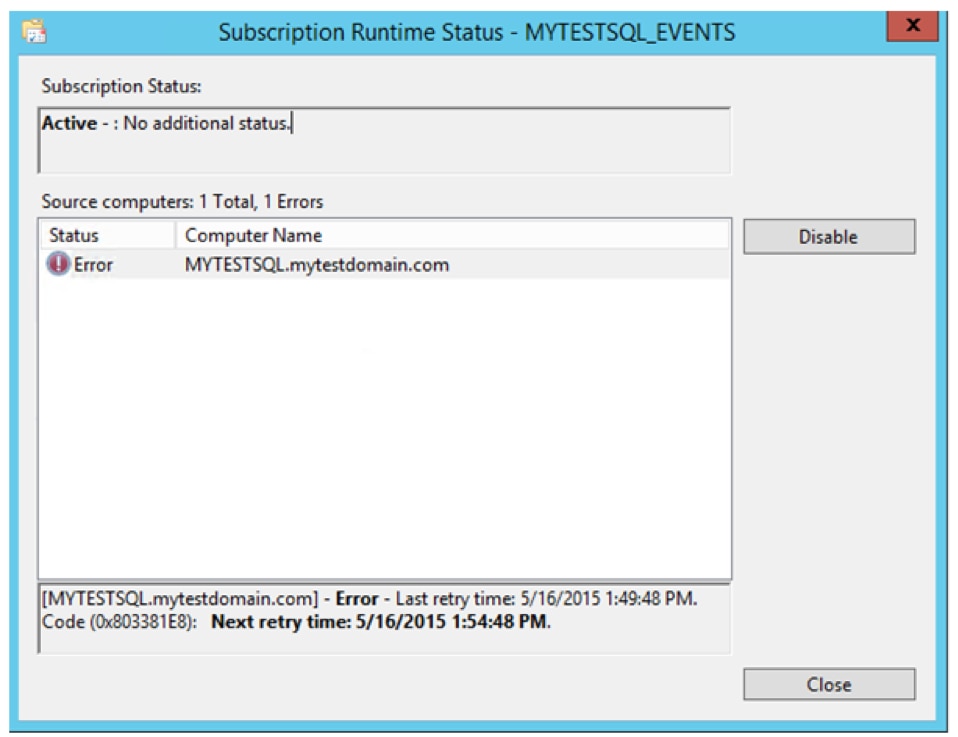
The Computer column in the Details pane indicates the events are from the remote computer MYTESTSQL.MYTESTDOMAIN.COM. You can enable or disable the collector subscription by right-clicking on the subscription and choosing Disable. The status of the subscription is then shown as disabled in the main window. An active collector subscription does not mean it is succeeding. To see if the collector can connect to the source, right-click on the subscription and select Runtime Status. In this example, the collector can’t connect to the source. By default, it retries every five minutes.
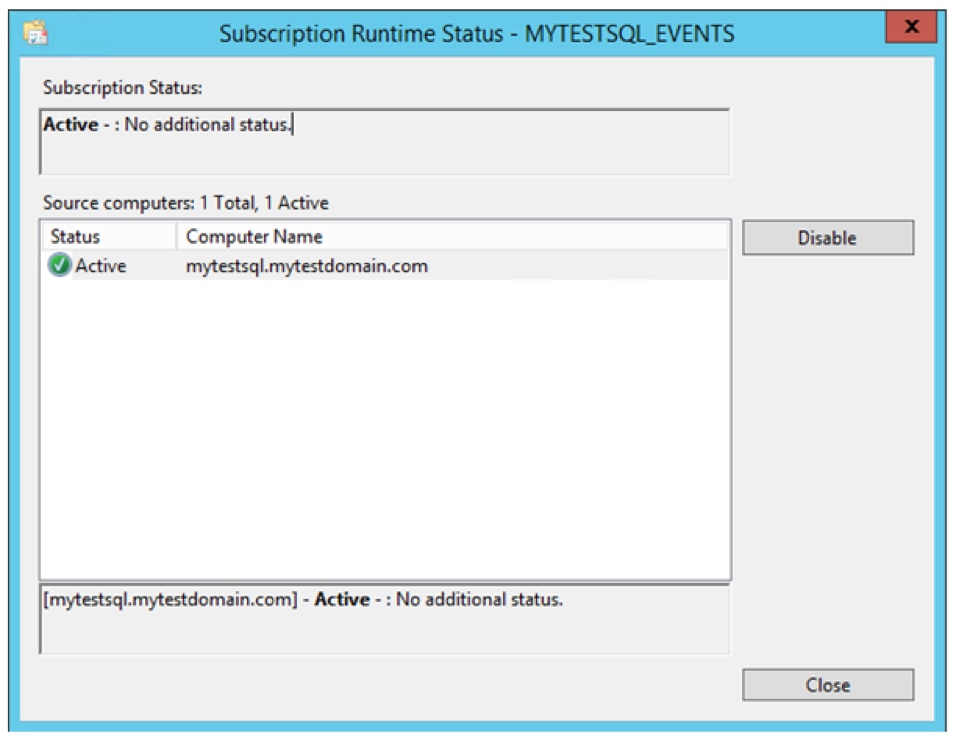
If all is OK, Subscription Runtime Status shows a green tick with an active status.
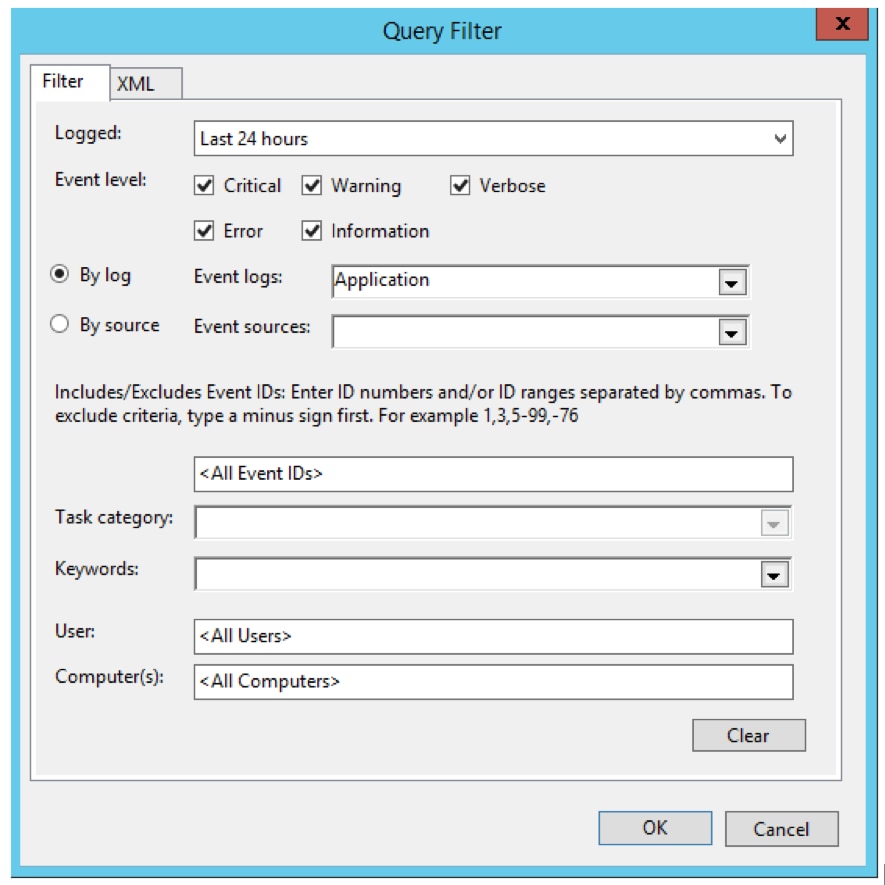
Once the events are forwarded, you can create custom views to see the consolidated events. For example, you might create a custom view for error events. This example creates a custom view for SQL Server–related messages. A collector computer may host thousands of records from dozens of servers. Using a custom view enables you to create order from an overload of information. For detailed steps, see the section Creating a Custom View in Windows Logging Basics.
There are several Windows services you can use to centralize all your logging data to an external logging service. These services send logs over syslog to a cross-platform log server or cloud-based logging service like SolarWinds® Loggly®.
We recommend NXLog, a popular, freely downloadable service that runs in the background. Alternately, there is syslog-ng and Snare, which are services that collect your log files. All these services provide additional professional support for a fee.
This example installs and configures NXlog to package your log files.
Download and install the current version of NXlog. The download includes an intuitive installer. Once the installation is complete, open the configuration file. By default, the NXLog configuration file is located at C:/Program Files (x86)/nxlog/conf/nxlog.conf
You can create different types of configuration modules.
Whenever you make changes to the NXlog configuration file, you must restart the NXlog service.
This example modifies the NXLog configuration file to centralize your Windows event logs. Adding the code snippet below to the end of your nxlog.conf file enables the module and gives it the name “eventlog”. The im_msvistalog input module sends new entries to the Windows event log, including system, hardware, application, and security-related events.
# Windows Event Log

<Input eventlog>

# Uncomment im_msvistalog for Windows Vista/2008 and later

Module im_msvistalog

# Uncomment im_mseventlog for Windows XP/2000/2003

# Module im_mseventlog

# If you prefer to send events as JSON data

Exec $Message = to_json();

</Input>
NXLog can be used to read logs files stored on a drive. In this example, the file name is FILE1. SavePos TRUE means that NXLog will track its current location in the log file on exit. Exec $Message = $raw_event means NXLog will ingest the raw log message without applying any additional formatting. The file name can also include directories or wild cards.
<Input FILE1>

Module im_file

File "FILE1"

SavePos TRUE

Exec $Message = $raw_event;

</Input>
As we covered in the Windows Logging Basics section, IIS logs contain access logs stored in W3C format. We recommend you convert them to JSON format for easy processing by a log management tool. NXLog can do this conversion using the W3C extension. Make sure you use the proper format in the configuration file, so the parsing happens correctly, and you are including log files from all your sites.
<Extension w3c>

Module xm_csv

Fields $date, $time, $s-ip, $cs-method, $cs-uri-stem, $cs-uri-query, $s-port, $cs-username, $c-ip, $csUser-Agent, $cs-Referer, $sc-status, $sc-substatus, $sc-win32-status, $time-taken

FieldTypes string, string, string, string, string, string, integer, string, string, string, string, integer, integer, integer, integer

Delimiter ' '

QuoteChar '"'

EscapeControl FALSE

UndefValue -

</Extension>

# Convert the IIS logs to JSON and use the original event time

<Input IIS_Site1>

Module    im_file

File    "C:/inetpub/logs/LogFiles/W3SVC1/u_ex*"

SavePos  TRUE

Exec if $raw_event =~ /^#/ drop();

else

{

w3c->parse_csv();

$SourceName = "IIS";

$Message = to_json();

}

</Input>
SQL Server is Microsoft’s enterprise-class flagship database platform. It comes in a suite of database and data warehouse tools. SQL Server typically has its own logs saved in the application’s installation directory in the Windows file system. The default location for SQL Server 2012 is C:/Program Files/Microsoft SQL Server/MSSQL11.MSSQLSERVER/MSSQL/Log. The log entries are also sent to the Windows application event log.
SQL Server operations like backup and restore, query timeouts, or slow I/Os are therefore easy to find from Windows application event log, while security-related messages like failed login attempts are captured in Windows security event log.
NXLog can forward logs from any of the inputs described above to an external destination such as a log server or cloud-based log management service. To do this, NXLog uses concepts called Outputs and Routes. Outputs are modules that provide functionality for sending logs to a destination, such as a file or remote server. Routes are the paths that a log message takes from an input (such as the im_msvistalog module) to an output (such as a log management service).
To forward logs, add an output module in your nxlog.conf configuration file. Then add a Route module to send logs from your chosen inputs to your chosen outputs. In this example, we are sending logs as syslog over TCP to the host HOSTNAME over the default syslog port 514. We create a route that takes logs from the eventlog input and sends it to the new output (named out):
<Output out>

Module om_tcp

Host HOSTNAME

Port 514

</Output>

<Route 1>

Path eventlog => out

</Route>
Several log management solutions offer specific setup instructions for Windows logging. Loggly is an example of one provider and has more detailed information about setting up NXLog to gather your log files in their guide, Logging from Windows.
By default, logs sent over the Internet are transmitted in clear text. This means snoopers can intercept and view your log data. It is best practice to encrypt your log data when it’s in transit, especially if it contains sensitive information like personal identification details, government-regulated data, or financial information. The most common protocol for encrypting syslog communication is TLS, or Transport Layer Security.
TLS encrypts your logs, preventing anyone from snooping on sensitive data in your logs. Best practice is not to log information like passwords, but some applications do it anyway. TLS encryption helps keep this data safer. Encryption prevents malicious parties located between your log sources and destinations from reading or modifying your log data.
Here is an example setting up NXLog configuration with TLS encryption for Loggly.
<Output out>
Module om_ssl
Host server.example.com
Port 6514
CAFile %CERTDIR%/example.crt
AllowUntrusted FALSE
<Output>
How do you centralize your logs? Add a comment to let us know!
Need more options? Don’t miss the SolarWinds Centralized Log Management