Technical Resources
Educational Resources
APM Integrated Experience
Connect with Us
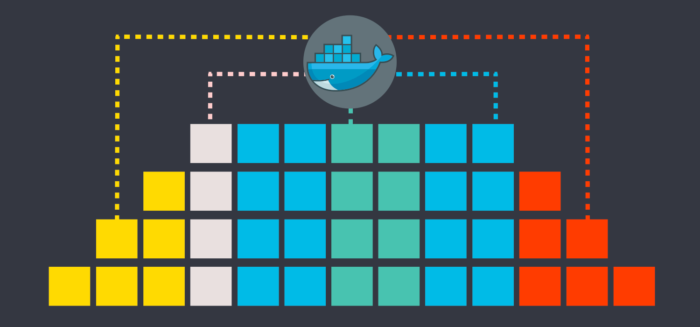
Running your apps and services inside of containers makes many things easier. From spinning up new services quickly to ensuring things work easily in production, Docker powers a large portion of modern software, and management of resulting logs is a critical task for developers.
However, managing all of those log messages and events can quickly become overwhelming if you aren’t following best practices or using the right tools and tricks. Fortunately, there are plenty of options to try. There are more than a few ways you can aggregate and manage your Docker logs, and the right choice for you depends on your environment and personal situation. But no matter how you’re using containers, there’s an effective way to retrieve your logs.
In this article, I’ll cover some of the best ways to extract logs from running containers, and provide tips on how to make your logs more useful by including identifiable strings. After that, we’ll take a look at where you should be sending your Docker container logs to make sure you can easily parse and search them to pull out the details you need for debugging and analysis.
By far the simplest and most user-friendly way to ship your container logs to SolarWinds® Loggly® is by using the Docker logging driver. Various logging drivers are available out of the box with Docker and you can configure your containers to send logs to Amazon Cloudwatch Logs, syslog servers, and fluentd daemons. The syslog driver is a great choice if you’re already running a syslog server such as rsyslogd on the host because Docker can route all logs there, making it easier to manage logs from large numbers of containers.
You can configure the logging driver by setting the value of the log-driver configuration option in your container’s daemon.json file. For example, to use the syslog logging driver, update your config file like this:
{
“log-driver”: “syslog,”
}If you’re in a situation where you can’t use one of the logging drivers and instead need to keep all of your logs in plain text, there’s an alternative option available to you. Docker’s support for data volumes enables you to share host directories with your containers, so they can write their logs directly on the host file system.
However, storing your log files in a shared directory doesn’t need to be the end of the story and there are methods of sending those log files to an aggregation service such as Loggly. Remote_syslog2 is a tiny standalone daemon capable of monitoring log files and then sending them to Loggly when new lines are written.
A third approach to aggregating logs from your Docker containers is to run a dedicated container to collect all the log messages from other containers and route them to an aggregation service. This is exactly how logspout works. Logspout attaches to all containers on a host and automatically sends their logs to third-party services. You don’t need to worry about already running containers or ones you’re going to start in the future—logspout will detect them and route their logs when they’re up and running.
Here’s an example showing how to run logspout with Loggly:
docker run --name logspout -d --volume=/var/run/docker.sock:/var/run/docker.sock
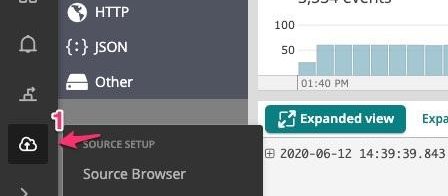
-e SYSLOG_STRUCTURED_DATA=”TOKEN@41058 tag=\”Logspout\”” gliderlabs/logspout syslog+tcp://logs-01.loggly.com:514Be sure to replace TOKEN with your customer token from the Source Setup page in Loggly.
One caveat with logspout is if you want multiline log messages—such as ones including crash messages or exceptions with call stacks—to appear as a single event, you’ll need to enable multiline support when starting logspout by including the multiline prefix.
docker run --name logspout -d --volume=/var/run/docker.sock:/var/run/docker.sock
-e SYSLOG_STRUCTURED_DATA=”TOKEN@41058 tag=\”Logspout\”” gliderlabs/logspout multiline+syslog+tcp://logs-01.loggly.com:514The sidecar approach is similar to the dedicated logging option. Only instead of having a single container responsible for routing logs to an aggregation service, you attach a separate logging container to each of your regular containers. This approach uses a shared volume accessible to both the sidecar (logging) container and the container generating the logs (the application container). As the application container writes its log files stored on the volume, the logging container watches those files for new entries and sends them to Loggly.
Because of the explosion of containers this method can create, each event needs to be tagged with the application container it came from, making it easier to analyze later. The sidebar approach scales more easily than the other methods listed in this article. It works best when you need to aggregate logs from a large number of containers because you can include custom identifiers and tags in your events.
Containers are so easy to scale, it’s often difficult to pinpoint exactly which environment an event came from. It’s not always possible to change the code of your apps and services, but you should try and include identifiable tags in your logs where to can, to help with troubleshooting and analysis later.
Helpful tags include things like the version of your container image and other software in the container, the container hostname, and its IP address. Any of these identifiable strings can pay dividends later when you’re searching through huge volumes of logs and need to trim away all the noise, so you can focus on debugging issues.
You can specify a tag to include in all log messages by using the –log-opt command-line option for Docker. For example, here’s how to run a container tagging log messages with c56app032:
$ docker run --log-driver=syslog --log-opt syslog-address=udp://127.0.0.1:5514
--log-opt syslog-facility=daemon --log-opt tag=c56app032 --name logging-02 -ti -dOnce you’ve decided how you’re going to pull logs from your containers, you need to pick somewhere to send them. There’s a wide range of logging aggregation services designed to accept logs from containers, but there are one or two features you should ensure are available before making a decision.
First, since containers are used everywhere today, you’ll need to pick a service with parsers for a huge range of log file formats, so each log message or event can be automatically parsed when it’s received. Running NGINX? Then you’ll need a tool designed to parse NGINX log files. Many containers run services like load balancers, web apps, and back-end services, so you’ll need to choose your logging service carefully.
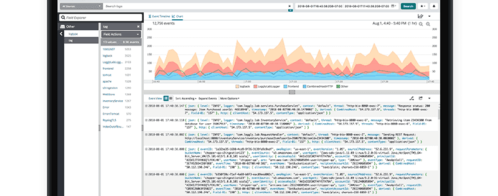
Once you’ve aggregated your containers logs in a central place, you’ll need to search through them to uncover patterns and trends in the data and use them for debugging and troubleshooting. Loggly covers all of these requirements and more. Dozens of articles have been written to cover running Docker with Loggly, making it the perfect place to aggregate and store your Docker container logs.
Didn’t find what you were after? Consider the SolarWinds Docker Monitoring with Log Analyzer