Technical Resources
Educational Resources
APM Integrated Experience
Connect with Us
Once your applications are running in Kubernetes, how do you know they’re working correctly? A common approach when you’re starting with Kubernetes is to use the kubectl tool. However, you need to have access to the cluster to read logs from containers. Additionally, when you have to read logs from several applications, it’s crucial to have a central place where all logs land. Mainly because by default, when containers terminate, you lose all the logs as well.
In this guide, you’ll learn how logging works in Kubernetes and how you can set up your systems to aggregate logs to SolarWinds® Loggly®. Once logs are there, you can learn more about how your systems behave and monitor their health. You only need to have a Kubernetes cluster as all the scripts I’ll use are on GitHub for your reference.
Before I dive in, let me explain briefly how logging works in Kubernetes. For starters, you should instrument your applications so they emit enough logs. These logs are going to be your eyes when your applications run in a live environment. You don’t have to do anything fancy to get started. In Kubernetes, it’s enough if your applications emit logs to the stdout or stderr. In other words, a simple “print” to the console is going to be enough.
But your applications aren’t the only source of logs. Many Kubernetes components emit logs by default, and when you need to investigate problems further, these types of logs become crucial. Without getting into the details of Kubernetes architecture, you can get logs from the control plane and the host running your pods.
Hence, you have three sources for logs: your applications, the control plane, and the hosts. A recommended approach is to have a pod running in each node of the cluster to process logs. In Kubernetes, this is called DaemonSets, which is how Kubernetes guarantees a pod runs in each worker node. Let’s get started with this configuration and deploy a logging agent in a Kubernetes cluster.
To follow this guide, you need to first complete the following tasks:
– Install and set up the kubectl tool to interact with Kubernetes
– Sign up for a Loggly account
I’m using a Kubernetes cluster in AWS, but it doesn’t matter where the cluster is running as long as they’re using the default locations for logging. And you might need to enable certain types of logs, as not all of them are enabled by default. So where can you find logs when using Kubernetes?
– For applications logs, you can find logs from all containers at /var/log/containers.
– For host logs, you can find them at /var/log/dmesg, /var/log/secure, and /var/log/messages.
– And for the control plane, you find them at /var/log/journal.
Now I’ll deploy a DaemonSet to send these types of logs to Loggly using Fluentd. But before we do anything else, we need a customer token. To generate one, log in to your Loggly account, and in the left panel, click on the “Source Setup” button (1) and then click on the “Customer Tokens” option (2).

Then either copy the existing token or generate a new one. You’ll use this to authenticate with Loggly.

Now it’s time to create a few objects in Kubernetes. First, let’s create a secret for the Loggly token using the following commands. You’ll create a namespace for this and future objects. Make sure you replace the word TOKEN with your custom token.
$ kubectl create namespace fluentd-loggly

$ kubectl create secret generic loggly-config --from-literal=loggly.token="TOKEN" -n fluentd-loggly
Then use the DaemonSet manifest I have on GitHub to deploy the Fluentd agent in each worker node. You can use the following command:
$ kubectl apply -f https://raw.githubusercontent.com/christianhxc/kubernetes-logging-loggly/master/manifests/loggly.yamlYou can check if everything is working as expected with the following command:
$ kubectl get pods -n fluentd-loggly

NAME                   READY   STATUS    RESTARTS   AGE

fluentd-loggly-ggmm5   1/1     Running   0          46s

fluentd-loggly-jnhsm   1/1     Running   0          46s

fluentd-loggly-qwnqh   1/1     Running   0          46s
And that’s it! The logs from the pods you deploy to the cluster will now be sent to Loggly.
Before we confirm everything is working, I want to make sure you understand what you just did. In the future, you might want to adapt any of the configurations to your needs. So, the previous YAML manifest creates the following objects in Kubernetes:
– A service account the pod running Fluentd uses
– A cluster role with the minimum permissions to get logs from pods across namespaces
– A cluster role binding to attach the role to the service account
– A config map including the Fluentd configuration files (for decoupling purposes)
– A DaemonSet to deploy a Fluentd pod into every worker node in the cluster
I recommend you explore in detail the manifest to learn things like where to change the Fluentd configuration files or where you define the log paths. In the configuration of Fluentd, you define the integration with Loggly, like this:
<match **>

  @type loggly

  loggly_url "https://logs-01.loggly.com/inputs/#{ENV['TOKEN']}/tag/application"

</match>
Next, let’s deploy a sample application to confirm logs are being sent to Loggly.
You can use the application I created, which is a simple HTTP API using Go. Every time you hit the endpoint, it returns a “Hello World!” message and emits some logs. You can find all the source code at GitHub. Additionally, I created a YAML manifest to deploy the sample application and another pod to test the application. I did this to generate some traffic automatically and see logs more quickly.
To deploy the sample application, you can use the following command:
$ kubectl apply -f https://raw.githubusercontent.com/christianhxc/kubernetes-logging-loggly/master/manifests/app.yamlTo confirm everything is working, you can run the following commands:
$ kubectl get pods

NAME                          READY   STATUS    RESTARTS   AGE

goapi-testing                 1/1     Running   0          3s

golang-api-57b95cf476-ff96m   1/1     Running   0          3s

golang-api-57b95cf476-nzbft   1/1     Running   0          3s

golang-api-57b95cf476-x2gh8   1/1     Running   0          3s
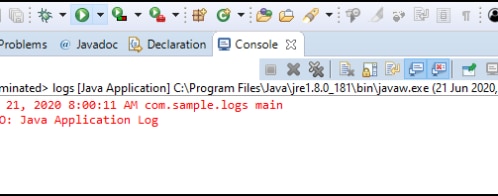
Notice how the goapi-testing pod is running, and when you see the logs, you’ll see the output from each request:
$ kubectl logs goapi-testing

Hello World!

Hello World!

Hello World!
Additionally, you could take a look at the logs from any of the application pods:
$ kubectl logs golang-api-57b95cf476-ff96m --tail=5

{"level":"warning","msg":"The group's number increased tremendously!","number":122,"omg":true,"time":"2020-06-12T13:28:22Z"}

{"animal":"walrus","level":"info","msg":"A group of walrus emerges from the ocean","size":10,"time":"2020-06-12T13:28:24Z"}

{"level":"warning","msg":"The group's number increased tremendously!","number":122,"omg":true,"time":"2020-06-12T13:28:24Z"}

{"animal":"walrus","level":"info","msg":"A group of walrus emerges from the ocean","size":10,"time":"2020-06-12T13:28:25Z"}

{"level":"warning","msg":"The group's number increased tremendously!","number":122,"omg":true,"time":"2020-06-12T13:28:25Z"}
Wait a few minutes, and you should be able to see those same logs in Loggly.
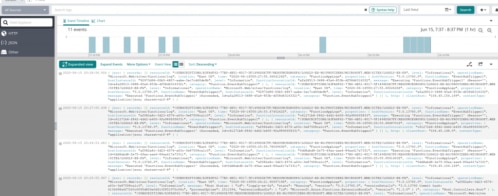
To explore the logs from your application, go to the left menu in Loggly and click on the “Search” button (1). Then you could configure the search to see only the logs from the last 30 minutes (2).

And you should see some log entries:

In the “Search logs” box, you could include filters to see only logs from the application, the control plane, or the host. For example, if you want only to see the logs from the application, the Fluentd configuration I used is adding an “application” tag to find logs easier. Also, notice each log has a JSON structure. This will make it easier to see only the logs you want or need.
This guide includes the basics for getting started with aggregating logs from Kubernetes to Loggly. You can explore the application I used, but you’ll only confirm I’m doing nothing special. I’m merely sending the logs to the console. Additionally, the manifests I used to deploy the Fluentd agent in every worker node in the cluster are a good starting point. Initially, you might not need to change it unless you want to use a specific configuration from Fluentd I didn’t include.
So, now you’re ready to begin aggregating Kubernetes logs into Loggly and troubleshoot your applications. To get started, sign up for SolarWinds Loggly and learn more about the advanced configurations available in the Fluentd plugin.
This post was written by Christian Meléndez. Christian is a technologist that started as a software developer and has more recently become a cloud architect focused on implementing continuous delivery pipelines with applications in several flavors, including .NET, Node.js, and Java, often using Docker containers.
Want something different? Try the SolarWinds Log Aggregation