What Does the Docker Daemon Log Contain?
There’s a wealth of material on logging in Docker, but most of it is centered around containers and applications. While logging containers is important, it misses out on a key component of the Docker architecture: the Docker daemon.
The Docker daemon provides crucial insight into the overall state of your microservice architecture. Container-centric logging methods let you extract useful information from your services, but offer little to no insight into the state of the Docker service as a whole. In this post, we’ll look at what the Docker daemon logs and how to collect and interpret the events it generates.
Events Logged by the Docker Daemon
The Docker daemon logs two types of events:
- Commands sent to the daemon through Docker’s Remote API
- Events that occur as part of the daemon’s normal operation
Remote API Events
The Remote API lets you interact with the daemon using common commands. Commands passed to the Remote API are automatically logged along with any warning or error messages resulting from those commands. Each event contains:
- The current timestamp
- The log level (Info, Warning, Error, etc.)
- The request type (GET, PUT, POST, etc.)
- The Remote API version
- The endpoint (containers, images, data volumes, etc.)
- Details about the request, including the return type
For example, listing the active containers on a Boot2Docker host generates the following log entry:
time="2015-11-18T11:28:50.795661833-05:00" level=info msg="GET /v1.21/containers/json"
Daemon Events
Daemon events are messages regarding the state of the Docker service itself. Each event displays:
- The current timestamp
- The log level
- Details about the event
The events recorded by the daemon provide detailed information on:
- Actions performed during the initialization process
- Features provided by the host kernel
- The status of commands sent to containers
- The overall state of the Docker service
- The state of active containers
Daemon events often provide detailed information about the state of containers. However, messages regarding a container may refer to the container by ID rather than by name. For instance, a container with the name “sleepy_nobel” failed to respond to a stop command. The stop command, along with the failure notification, generated the following events:
time="2015-11-18T11:28:40.726969388-05:00" level=info msg="POST /v1.21/containers/sleepy_nobel/stop?t=10"
time="2015-11-18T11:28:50.754021339-05:00" level=info msg="Container b5e7de70fa9870de6c3d71bf279a4571f890e246e8903ff7d864f85c33af6c7c failed to exit within 10 seconds of SIGTERM - using the force"
You can retrieve a container’s ID by using the docker inspect command.
Where to Find the Daemon Log
Docker uses logrus, a structured logging framework for the Go programming language, to generate and format log events. When started using a process manager (such as systemd or Upstart), the daemon writes events to a log file. The following table shows the location of the log file in various operating systems and platforms:
Platform |
File Location |
| Ubuntu | /var/log/upstart/docker.log |
| Boot2Docker | /var/log/docker.log |
| Debian1 | /var/log/daemon.log |
| Systemd based OSes (CoreOS, SUSE, Fedora, CentOS, Red Hat Enterprise | journalctl -u docker.service |
| Windows 10 | %APPDATA%\Local\Docker\log.txt |
| Windows Server 2016 | Windows Application Event Log |
1For installations using SysVinit. As of version 8.2, Debian uses systemd by default.
If the Docker daemon is started on a terminal using the docker daemon command, it prints log events directly to the terminal. However, we recommend starting the daemon as a service. Let’s look at the differences between these two methods.
Log Formats
Depending on whether the Docker daemon is started through a terminal or through a process manager, events can take one of two forms. Events recorded through a process manager2 are stored in logfmt, a key-value pair format that can be easily parsed by Loggly either as a JSON entry or by using derived fields. Events recorded through the command line, on the other hand, are less structured and are designed for easier readability.
2There’s a known bug in Upstart where the daemon uses the terminal format by default.
Logfmt
Logs generated by the Docker daemon when it’s running as a service take the form of logfmt events. Entries display a UTC timestamp followed by the log level and message. For example, using docker run to create a new container generates the following message:
time="2015-11-17T16:35:15.290647728-05:00" level=info msg="POST /v1.21/containers/create?name=loggly"
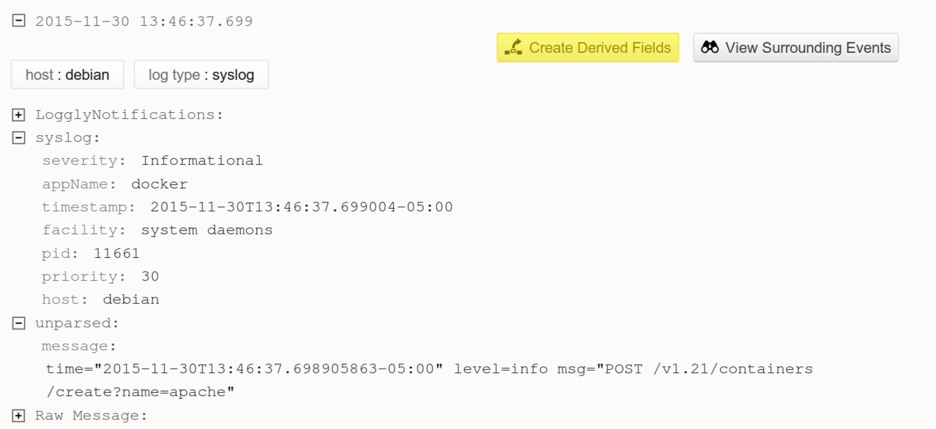
Operating systems using systemd will format log entries using the syslog message format. In this case, the logfmt entry is prepended with additional information such as the system timestamp, hostname, and the process that generated the log entry. For instance, the same log event shown above takes the following form in Debian’s daemon.log file:
Nov 17 16:35:15 virtualbox-debian docker[2990]: time="2015-11-17T16:35:15.290647728-05:00" level=info msg="POST /v1.21/containers/create"
You can forward these events to Loggly by using the configure syslog script. Note that this event is treated as a syslog event in Loggly. Syslog fields will be accurately processed, but the embedded logfmt entry will appear as an unparsed message. We can resolve this by creating a derived field that will extract the unparsed data from the syslog event.
Logging in Windows
With the release of Windows Server 2016 and the Windows 10 Anniversary Update, running Docker containers in Windows is easier than ever. You can even run Windows containers, which provide a complete native Windows environment in container form.
The location of the Docker Engine log depends on the environment that it’s running in. On Windows 10, Docker is typically installed using Docker for Windows, which provides a GUI frontend for configuring Docker, containers, and images. With Docker for Windows, the log file is stored in %APPDATA%\Local\Docker\log.txt. You can also access the log file by running Docker for Windows, right-clicking the icon in the system tray, clicking Diagnose & Feedback, and clicking the log file link. Each entry is formatted with the logfmt message format prepended with the timestamp, source, and log level. For example, requesting a list of running containers results in the following entry:
[21:40:55.918][ApiProxy ][Info ] proxy >> GET
/v1.25/containers/json
On Windows Server 2016, Docker is typically installed via the Windows® Server Manager and Windows PowerShellTM. The Docker service logs to the Windows Application Event Log, with “docker” as the source application.
As with Linux, you can also change the logging driver to log to a different output such as a JSON file or GELF endpoint. You can learn more about managing Windows logs in the Ultimate Guide to Logging.
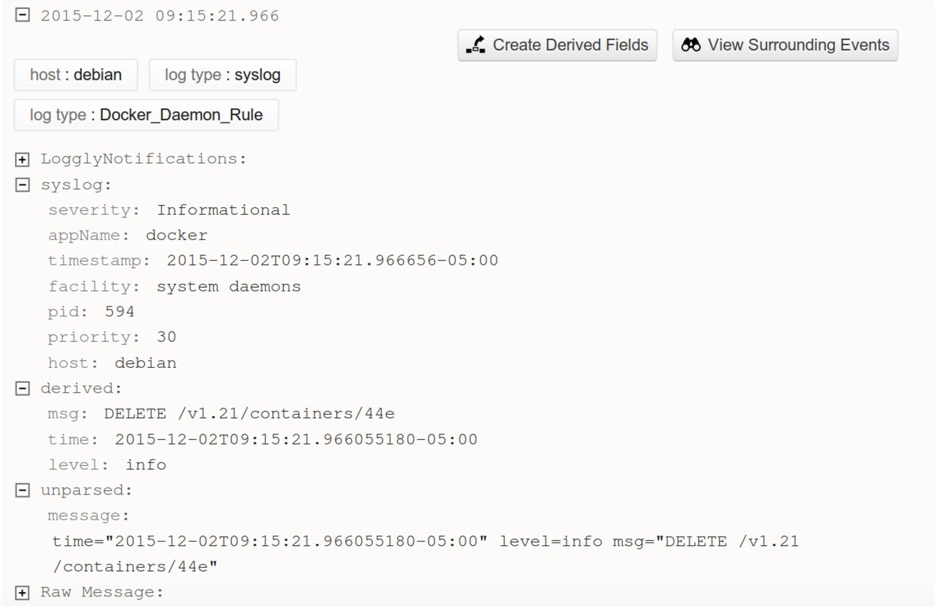
Creating Derived Fields
Derived fields let you pull and organize data from the part of the event that wasn’t automatically parsed by Loggly. There are several options for extracting data, from defining simple key-value pairs to using regular expressions (regex). Because of the variety of logs sent from the Docker daemon, we’ll use regex to identify key pieces of information. We’ll also use the capture groups feature of regex to define the parts of the message that correspond to our new fields. Note that derived fields are only available to Loggly Pro and Enterprise customers.
To create a derived field, click the Create Derived Fields button next to an event with an unparsed message, or click Derived Fields at the top of the page.
Enter a name for the rule, such as “Docker_Daemon_Rule.” Click the RegEx tab and enter the following statement under “Event matches Regex:”
^time="(\S*)" level=(\S*) msg="(.*)"$
From here, you can define the sources that the rule will apply to and test the rule against your existing log events. You can change the names of the fields extracted from the regular expression so that they more closely resemble the original logs. Once everything looks good, click the Save Rule button. From now on, Loggly will automatically check incoming log events to see if they match your rule. If they do match, the fields will be extracted and will appear in the Field Explorer.
Sending Systemd Events to Loggly
Systemd stores log events in the systemd journal. The journal stores events in a binary format as opposed to traditional text files, so we need a way to extract and convert them before sending them to Loggly. We can do this by running rsyslog as a proxy between systemd and Loggly.
Install and start the rsyslog service. Systemd forwards events to a syslog socket by default, but you can verify this by opening /etc/systemd/journald.conf and verifying that the FORWARDTOSYSLOG parameter is set to YES. If it’s set to NO, change the value to YES and restart the systemd-journald service. For more information, see the Centralizing with Syslog section of the Loggly-sponsored, community Ultimate Guide to Logging.
Once rsyslog is up and running, run the Loggly configure syslog script to begin forwarding events to Loggly. You can test the functionality by creating a container in Docker and searching for new events in Loggly. This may incur a small performance penalty since log data is now being written to two separate locations. However, the benefit is that your logs are now being stored in a redundant, centralized location.
Terminal
When running the Docker daemon via command line, log events are formatted for easier readability. This makes them much more difficult to parse than logfmt events, since the data is unstructured and does not include a standard timestamp. Additionally, the color-coding used by logrus is embedded into each event, making it difficult to extract plain text log data. For these reasons, we recommend running the Docker daemon using a process manager and logging in logfmt instead.
What Can We Do with Docker Daemon Logs?
The daemon log provides insights into our services that we can’t generate through container-based logging. More specifically, it details the interactions between containers, the Docker service, and the host machine. Collecting and aggregating these interactions lets us track the lifecycles of our containers, as well as identify disruptions in service.
Imagine a container is shutting down without warning. The container stops before any log events can be recorded, so we can’t use the docker logs command or an application-based logging framework to identify the root cause. Instead, we can filter the daemon log to events containing the container name or container ID and sort by timestamp. This lets us create a timeline of the container from its creation to its destruction. In the following image, we tried to start a container running the Apache HTTP Server. The server failed to respond, so we issued a restart command only to find out the container hasn’t been created yet. We then used docker run only to find out that the image hasn’t been built. We then built an image based on an existing Dockerfile, named it apache, and created a container based on that image:

The daemon log also provides valuable information about the state of the host. If the host kernel doesn’t support a certain feature, or if the host configuration is suboptimal, the Docker daemon will note it during the initialization process. Non-optimal settings are assigned a log level of Warning, which makes it easy to filter and review recommendations. By forwarding events from your hosts to Loggly, not only are you reducing the risks of losing log data due to unexpected failures, but you can consolidate log data from multiple hosts.
Where Do We See Daemon Logging in the Future?
Many users recognize the need for a more robust logging solution for the Docker daemon. While there are a diverse number of methods for logging containers, logging the daemon itself is still very limited. As logging becomes a higher priority in the Docker ecosystem, we hope to see:
- A consistent default logging behavior across all operating systems
- Customizable parameters such as the destination file
- Separation of log events based on the Docker component that generated them
While there has been some progress (you can now filter out logs below a certain level by passing the –log-level parameter to the daemon during startup), logging the Docker daemon still has a long way to go before it becomes as widespread and intuitive as logging containers. Daemon logging might never have the same widespread focus as container logging, but that doesn’t mean it’s any less vital to the health of your infrastructure.
Related Reading: Top 5 Docker Logging Methods to Fit Your Container Deployment Strategy »
The Loggly and SolarWinds trademarks, service marks, and logos are the exclusive property of SolarWinds Worldwide, LLC or its affiliates. All other trademarks are the property of their respective owners.

Andre Newman