Technical Resources
Educational Resources
APM Integrated Experience
Connect with Us
Running your web applications on the powerful Internet Information Services (IIS) platform from Microsoft has many upsides. For one, you’ll benefit from the support offered by the tech giant. But making sure your applications run at optimal health is often left to your own devices. Carrying out an IIS log analysis is the best way to see how your IIS-hosted applications are performing.
This article demonstrates one of the most efficient ways to carry out IIS log collection and interpretation processes with the use of a centralized dashboard and analyzer. We’ll suggest a tool other than what Microsoft makes available. We also discuss several best practices for handling IIS logs.
Before we dive into a walkthrough, it’s imperative to discuss the various log handling problems from using IIS. Then we can address some gaps and show you how to maneuver past these problems.
Without any third-party tools, an IIS log file is often where you’d look to access server event history. Because the IIS management portal provides an easily understood graphical user interface (GUI), locating log files and regularly monitoring them for changes becomes a habit quickly. IIS logs are stored in ASCII format, making them difficult to interpret. The ASCII formatted logs list events and timestamps, but parsing the data into useful information takes a trained eye.
As you would expect for an application with multiple users connected to it simultaneously, the logs are often extensive. As a result, crucial system health events can drown in the noise of all the access events logged. Sifting through a log file with lots of access events could take more time than it takes to maintain an application’s peak performance.
To thoroughly understand how difficult things can get when troubleshooting IIS issues from log files, let’s look at an example. This is what a typical IIS log file looks like:
#Software: Microsoft Internet Information Services 10.0

#Version: 1.0

#Date: 2019-11-15 23:13:49

#Fields: date time s-ip cs-method cs-uri-stem cs-uri-query s-port cs-username c-ip cs(User-Agent) cs(Referer) sc-status sc-substatus sc-win32-status time-taken

2019-11-15 23:13:49 ::1 GET / - 55831 - ::1 Mozilla/5.0+(Windows+NT+10.0;+Win64;+x64)+AppleWebKit/537.36+(KHTML,+like+Gecko)+Chrome/78.0.3904.97+Safari/537.36 - 200 0 0 27845

2019-11-15 23:13:49 ::1 GET /Content/bootstrap.css - 55831 - ::1 Mozilla/5.0+(Windows+NT+10.0;+Win64;+x64)+AppleWebKit/537.36+(KHTML,+like+Gecko)+Chrome/78.0.3904.97+Safari/537.36 http://localhost:55831/ 200 0 0 181

2019-11-15 23:13:49 ::1 GET /Content/site.css - 55831 - ::1 Mozilla/5.0+(Windows+NT+10.0;+Win64;+x64)+AppleWebKit/537.36+(KHTML,+like+Gecko)+Chrome/78.0.3904.97+Safari/537.36 http://localhost:55831/ 200 0 0 222

2019-11-15 23:13:49 ::1 GET /Scripts/bootstrap.js - 55831 - ::1 Mozilla/5.0+(Windows+NT+10.0;+Win64;+x64)+AppleWebKit/537.36+(KHTML,+like+Gecko)+Chrome/78.0.3904.97+Safari/537.36 http://localhost:55831/ 200 0 0 243

2019-11-15 23:13:49 ::1 GET /Scripts/respond.js - 55831 - ::1 Mozilla/5.0+(Windows+NT+10.0;+Win64;+x64)+AppleWebKit/537.36+(KHTML,+like+Gecko)+Chrome/78.0.3904.97+Safari/537.36 http://localhost:55831/ 200 0 0 269

2019-11-15 23:13:49 ::1 GET /Scripts/modernizr-2.6.2.js - 55831 - ::1 Mozilla/5.0+(Windows+NT+10.0;+Win64;+x64)+AppleWebKit/537.36+(KHTML,+like+Gecko)+Chrome/78.0.3904.97+Safari/537.36 http://localhost:55831/ 200 0 0 293

2019-11-15 23:13:49 ::1 GET /Scripts/jquery-1.10.2.js - 55831 - ::1 Mozilla/5.0+(Windows+NT+10.0;+Win64;+x64)+AppleWebKit/537.36+(KHTML,+like+Gecko)+Chrome/78.0.3904.97+Safari/537.36 http://localhost:55831/ 200 0 0 304

2019-11-15 23:13:53 ::1 GET /favicon.ico - 55831 - ::1 Mozilla/5.0+(Windows+NT+10.0;+Win64;+x64)+AppleWebKit/537.36+(KHTML,+like+Gecko)+Chrome/78.0.3904.97+Safari/537.36 http://localhost:55831/ 200 0 0 16

2019-11-15 23:14:08 ::1 GET / - 55831 - ::1 Mozilla/5.0+(Windows+NT+10.0;+Win64;+x64)+AppleWebKit/537.36+(KHTML,+like+Gecko)+Chrome/78.0.3904.97+Safari/537.36 http://localhost:55831/ 200 0 0 30

2019-11-15 23:14:28 ::1 GET /Help - 55831 - ::1 Mozilla/5.0+(Windows+NT+10.0;+Win64;+x64)+AppleWebKit/537.36+(KHTML,+like+Gecko)+Chrome/78.0.3904.97+Safari/537.36 http://localhost:55831/ 200 0 0 14190

2019-11-15 23:14:28 ::1 GET /Areas/HelpPage/HelpPage.css - 55831 - ::1 Mozilla/5.0+(Windows+NT+10.0;+Win64;+x64)+AppleWebKit/537.36+(KHTML,+like+Gecko)+Chrome/78.0.3904.97+Safari/537.36 http://localhost:55831/Help 200 0 0 32

2019-11-15 23:14:42 ::1 GET /Help/Api/GET-api-Account-UserInfo - 55831 - ::1 Mozilla/5.0+(Windows+NT+10.0;+Win64;+x64)+AppleWebKit/537.36+(KHTML,+like+Gecko)+Chrome/78.0.3904.97+Safari/537.36 http://localhost:55831/Help 200 0 0 633

2019-11-15 23:15:23 ::1 GET /Help/Api/GET-api-Tracker - 55831 - ::1 Mozilla/5.0+(Windows+NT+10.0;+Win64;+x64)+AppleWebKit/537.36+(KHTML,+like+Gecko)+Chrome/78.0.3904.97+Safari/537.36 http://localhost:55831/Help 200 0 0 51

2019-11-15 23:15:27 ::1 GET /Help/Api/GET-api-Bales - 55831 - ::1 Mozilla/5.0+(Windows+NT+10.0;+Win64;+x64)+AppleWebKit/537.36+(KHTML,+like+Gecko)+Chrome/78.0.3904.97+Safari/537.36 http://localhost:55831/Help 200 0 0 26

2019-11-15 23:15:45 ::1 GET / - 55831 - ::1 Mozilla/5.0+(Windows+NT+10.0;+Win64;+x64)+AppleWebKit/537.36+(KHTML,+like+Gecko)+Chrome/78.0.3904.97+Safari/537.36 http://localhost:55831/Help 200 0 0 10
With little analysis, you can extract application access details from the log above. But this snippet accounts for only 2% of the total file. Further, it offers very few details about exactly what happened on the pages visited in the IIS-hosted application. This makes it hard to pinpoint exactly where an event that caused a performance dip occurred, or which user triggered it.
There are plenty of other problematic scenarios we could explore, but these three are the most prevalent on IIS-related forums. Problems of this nature (too much data and noise on the same plate) give rise to the need for third-party solutions. This is where SolarWinds® Loggly® comes into play.
The visual appeal of the .txt file format is enough to discourage an attempt at IIS log analysis. A central dashboard from which to visualize IIS logs can help solve the problems discussed above. In addition, the ability to view a graph of how an IIS-hosted application is performing helps you determine immediately if its health is getting better or worse.
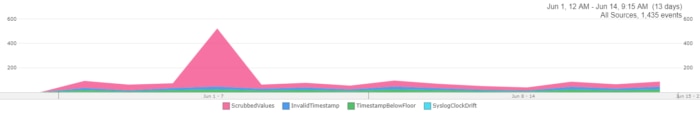
The Loggly snapshot below demonstrates this idea:
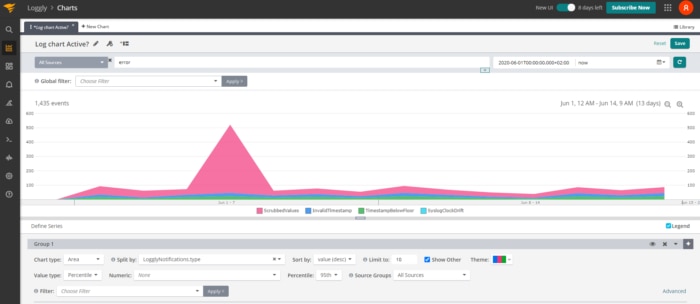
This figure is an example of what’s possible when you view a chart that visually displays when different types of IIS errors occurred. From a single look, you can deduce the most common error and how often it happened within a set time frame.
While addressing various problems with reading IIS logs, I saved a report from within the Loggly log management service. Saving .png images of each chart created in the log management system makes it easy to include key players to help you solve performance issues. Even presentations with non-technical personnel become less daunting and easier to consume.
Using charts is one smart way of managing logs. Loggly also provides the ability to search through the noise (inherent in normal .txt log files) for specific keywords using a query language. This allows you to isolate a problem type and investigate why it happened, based on the events prior to or attached to it. The opposite would be trying to remember each occurrence and deconceptualizing them to troubleshoot issues.
The search tab of the Loggly tool allows you to pare down the list events inside and around your application(s). A simple search such as apache.status:>=500 OR nginx.status:>=500 makes it easy to sift through a large volume of data. System support decisions are easier to make when the data is displayed in the format depicted below.
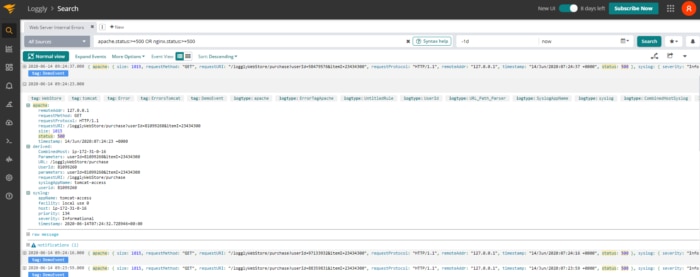
You can export the search results in JSON, CSV, or plain .txt format choices. Maintaining an IIS-based application is a long-term commitment. It helps to save your most common search queries in Loggly. When you collaborate, solving system issues is easy for other team members who need to see the origin of crash data.
The best way to troubleshoot IIS problems is to use more than a single set of eyes to analyze the logs. CI/CD (continuous integration + continuous delivery) pipelines often have different teams handling different parts of a single product at any given time. Take advantage of these teams by including database developers, along with front-end and back-end teams, when tracing problems. Compared to scouring through all the data manually and on your own to figure out how each app file acts when accessed, collaboration makes light work of seemingly insurmountable tasks.
Log management software that integrates with popular team communication applications makes maintaining an application easier. However, it’s best practice to have the smallest number of said software integrated with your product delivery system. With Loggly, you can have your entire team look at different views of an application’s log data (subsets of data arranged visually) to cover more ground more quickly. Security-wise, you can set user access levels to determine how much someone can do based on their role.
If you’ve been having trouble making sense of your IIS logs, try importing them into Loggly. Apart from making your life easier, you effectively get an application performance management tool. Using the Loggly application can make your log files easier to handle. The three most common problems developers face when analyzing data shouldn’t plague you. And, using SolarWinds Loggly to handle IIS logs allows you to focus more on making better software and less on reading log files.
This post was written by Taurai Mutimutema. Taurai is a systems analyst with a knack for writing, which was probably sparked by the need to document technical processes during code and implementation sessions. He enjoys learning new technology and talks about tech even more than he writes.
Still searching? You may be interested in the SolarWinds Microsoft IIS Log Analysis.